S&P 500: 5 Bullish Mid-Term Signals Pointing Towards a Strong Q4 Performance
Investing.com | Nov 27, 2023 04:36AM ET
- Volatility, gauged by the Vix indicator, has seen a remarkable 41% decrease in the past four weeks, marking its ninth most significant drop within this historical timeframe.
- Meanwhile, managers are actively divesting from dollars at the fastest rate in a year, under the conviction that further interest rate hikes are unlikely.
- Watch out for the famous 8 days at the end of November, which do not usually disappoint markets.
- Missed out on Black Friday? Secure your up to 55% discount on InvestingPro subscriptions only this Cyber Monday.
- A robust first half.
- A relatively weaker third quarter.
- Currently, we find ourselves in a theoretically bullish year-end stretch, with the S&P 500 exhibiting a noteworthy uptick of over +7% in November.
- 2016: -53%, reaching 12
- 2018: -50%, reaching 14.6
- 2020: -45%, reaching 20.8
- 2020: -45%, reaching 35.9
- 2021: -44%, reaching 17.2
- 2013: -43%, reaching 12.9
- 2011: -43%, reaching 24.5
- 2020: -42%, reaching 38.2
- Current year 2023: -41%, reaching 12.5
- One year later, with only one exception, it showed an upward trend.
- Nine months later, barring two occasions, it exhibited an upward trajectory.
- Six months later, with only one exception, it registered an increase.
- Day 23: +0.20%
- Day 24: +0.48%
- Day 25: +0.15%
- Day 26: +0.21%
- Day 27: +0.22%
- Day 28: +0.12%
- Day 29: +0.03%
- Day 30: +0.09%
1. History Is Repeating Itself to Perfection so Far in 2023
Perhaps now is an opportune moment to recall that historically, the period from November through January stands out as the most bullish three-month stretch of the entire year. Not only that, it marks the start of the most bullish six-month phase for the stock market.
In the ongoing 2023, we've witnessed the display of the exact historical pattern:
Turning our attention to the S&P 500, historical data since 1945 reveals Thanksgiving week as favorable, boasting an average gain of +0.60%. Since 2000, this figure has risen to +0.87%.
Does this imply investors should gear up for the much-awaited Santa rally? We shall see. But odds are certainly stacked in bulls' favor.
2. The historical Drop in Volatility
The VIX volatility indicator has undergone a significant downturn, plummeting by -41% in the past four weeks (from 21.27 to 12.46). This marks the ninth most substantial 4-week drop in its entire history.
Closing Friday's session at 12.46, the VIX hit its lowest level since January 2020. Let's delve into the nine most noteworthy 4-week declines:
Here's an intriguing tidbit: examining the S&P 500's performance following these occurrences:
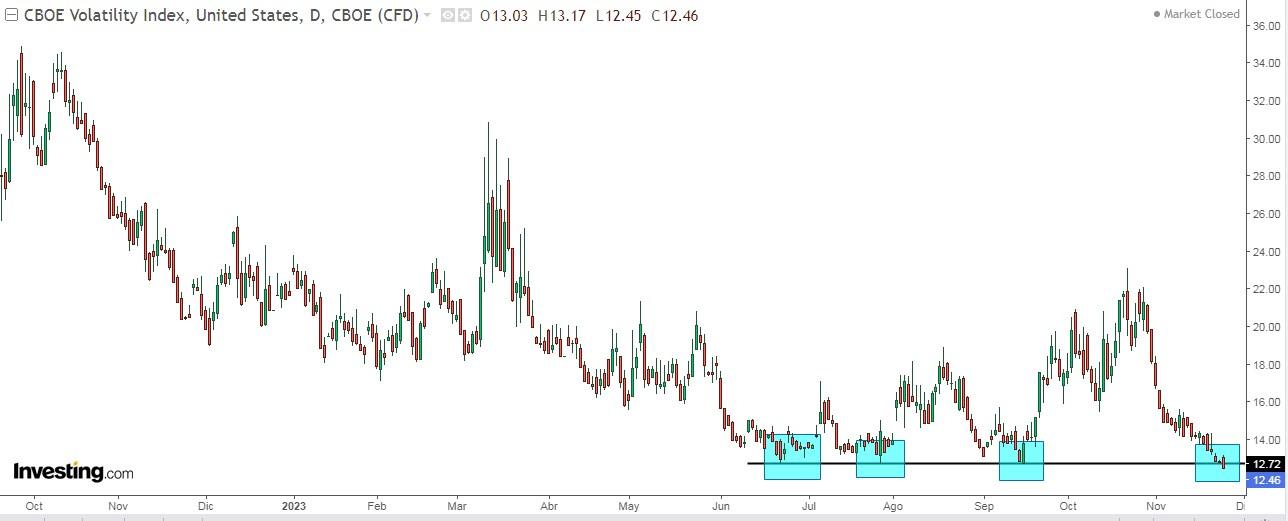
At the moment it is resting on its support, being the chart clarifying as to the relevance of that area.
3. The 8 Bullish Days at the End of November
The renowned eight-day stretch at the close of November signals a highly favorable period for the markets. In the case of the S&P 500, dating back to 1950, the days from the 23rd to the 30th have proven consistently interesting; in fact, the market has never, on average, experienced a decline during this timeframe.
The breakdown is as follows:
Let's observe whether history repeats itself once more this time around.
4. US Dollar Selling
Institutional managers no longer have confidence in the US dollar, as they believe that the Federal Reserve has reached its ceiling and will not continue to raise interest rates, possibly even pivoting lower in 2024.
As a result, they are selling dollars at the strongest pace in a year, having shed 1.6% of their open positions.
According to State Street, there have only been six such rapid sales in the past two decades, with the closest in time taking place in November 2022.
A decline in the value of the dollar indicates that foreign consumers and governments receive a greater amount of dollars for every unit of their domestic currency. This expanded purchasing capability allows them to acquire a larger volume of goods and services from US companies thus reflecting in better earnings for global US-based companies in the upcoming quarter.
5. Investor sentiment (AAII)
Bullish sentiment, i.e. expectations that stock prices will rise over the next six months, increased 1.2 percentage points to 43.8%. Optimism remains above its historical average of 37.5%.
Bearish sentiment, i.e., expectations that stock prices will decline over the next six months is at 28.1% and remains below its historical average of 31%.
***
Missed out on Black Friday? No problem, we've got you covered for
Disclosure: The author does not own any of the securities mentioned in this report.
Trading in financial instruments and/or cryptocurrencies involves high risks including the risk of losing some, or all, of your investment amount, and may not be suitable for all investors. Prices of cryptocurrencies are extremely volatile and may be affected by external factors such as financial, regulatory or political events. Trading on margin increases the financial risks.
Before deciding to trade in financial instrument or cryptocurrencies you should be fully informed of the risks and costs associated with trading the financial markets, carefully consider your investment objectives, level of experience, and risk appetite, and seek professional advice where needed.
Fusion Media would like to remind you that the data contained in this website is not necessarily real-time nor accurate. The data and prices on the website are not necessarily provided by any market or exchange, but may be provided by market makers, and so prices may not be accurate and may differ from the actual price at any given market, meaning prices are indicative and not appropriate for trading purposes. Fusion Media and any provider of the data contained in this website will not accept liability for any loss or damage as a result of your trading, or your reliance on the information contained within this website.
It is prohibited to use, store, reproduce, display, modify, transmit or distribute the data contained in this website without the explicit prior written permission of Fusion Media and/or the data provider. All intellectual property rights are reserved by the providers and/or the exchange providing the data contained in this website.
Fusion Media may be compensated by the advertisers that appear on the website, based on your interaction with the advertisements or advertisers.