Smart Traders Who Realize This Pattern In WTIC Could Make A Killing
Phoenix Capital Research | May 26, 2016 09:26AM ET
The markets are tracking the same pattern that played out in 2015.
Most market action (more than 80%) today is driven by computer algorithms. These programs look for an asset class that is moving, and then buy based on the momentum.
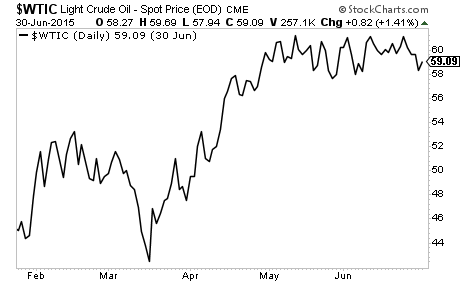
From March through May, the moving asset class is oil, which historically tends to rally during this period. In 2015, oil bottomed in March and rallied hard into June.
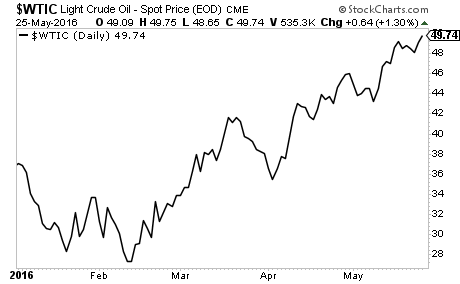
This year, the same pattern played out. However, the pattern hit a month early as traders and computers tried to front-run each other. Oil bottomed in February and has risen to $50 per barrel.
Anyone who is buying into this rally in the belief that it represents the start of a new bull market needs to consider what happened in 2015 when the seasonal trend ended: oil crashed, pulling stock down with it.
We’re currently preparing for a similar situation today.
Trading in financial instruments and/or cryptocurrencies involves high risks including the risk of losing some, or all, of your investment amount, and may not be suitable for all investors. Prices of cryptocurrencies are extremely volatile and may be affected by external factors such as financial, regulatory or political events. Trading on margin increases the financial risks.
Before deciding to trade in financial instrument or cryptocurrencies you should be fully informed of the risks and costs associated with trading the financial markets, carefully consider your investment objectives, level of experience, and risk appetite, and seek professional advice where needed.
Fusion Media would like to remind you that the data contained in this website is not necessarily real-time nor accurate. The data and prices on the website are not necessarily provided by any market or exchange, but may be provided by market makers, and so prices may not be accurate and may differ from the actual price at any given market, meaning prices are indicative and not appropriate for trading purposes. Fusion Media and any provider of the data contained in this website will not accept liability for any loss or damage as a result of your trading, or your reliance on the information contained within this website.
It is prohibited to use, store, reproduce, display, modify, transmit or distribute the data contained in this website without the explicit prior written permission of Fusion Media and/or the data provider. All intellectual property rights are reserved by the providers and/or the exchange providing the data contained in this website.
Fusion Media may be compensated by the advertisers that appear on the website, based on your interaction with the advertisements or advertisers.