Market Watch: Bears Missing Their Chance?
Ryan Mallory | Nov 20, 2013 02:48PM ET
It is getting tough in this market to decipher what the charts are trying to tell us when it comes to the SharePlanner Reversal Indicator. Primarily because I use both a daily and a weekly version and try to make sense out of both.
So when the two time frames may be giving conflicting messages, the challenge is to figure out what they share in common.
On the daily SPRI, you have a reversal to the upside just getting underway, which may mean that the pullback from the past two days is done and over with.
Here's the daily SPRI:
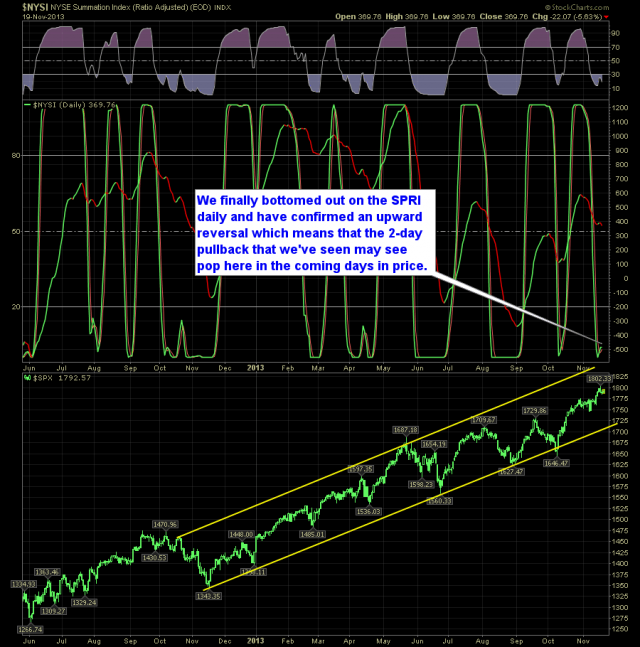
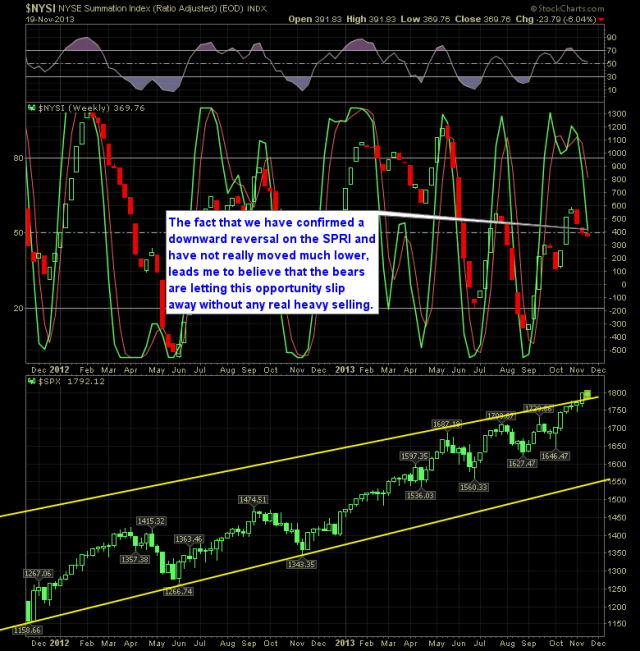
On the weekly chart it is showing that we are halfway through a pullback that has not yet happened. And considering the fact that the Daily SPRI has bottomed, it tells me there is a good chance, the weekly push lower on the SPRI will come and go without any true downside impact to stocks.
Here's the weekly SPRI
Original post
Trading in financial instruments and/or cryptocurrencies involves high risks including the risk of losing some, or all, of your investment amount, and may not be suitable for all investors. Prices of cryptocurrencies are extremely volatile and may be affected by external factors such as financial, regulatory or political events. Trading on margin increases the financial risks.
Before deciding to trade in financial instrument or cryptocurrencies you should be fully informed of the risks and costs associated with trading the financial markets, carefully consider your investment objectives, level of experience, and risk appetite, and seek professional advice where needed.
Fusion Media would like to remind you that the data contained in this website is not necessarily real-time nor accurate. The data and prices on the website are not necessarily provided by any market or exchange, but may be provided by market makers, and so prices may not be accurate and may differ from the actual price at any given market, meaning prices are indicative and not appropriate for trading purposes. Fusion Media and any provider of the data contained in this website will not accept liability for any loss or damage as a result of your trading, or your reliance on the information contained within this website.
It is prohibited to use, store, reproduce, display, modify, transmit or distribute the data contained in this website without the explicit prior written permission of Fusion Media and/or the data provider. All intellectual property rights are reserved by the providers and/or the exchange providing the data contained in this website.
Fusion Media may be compensated by the advertisers that appear on the website, based on your interaction with the advertisements or advertisers.