Semiconductors Show Technical Upside
Gregory W. Harmon | May 26, 2017 02:24PM ET
We end the week with a long-term look at the Semiconductor Index. These stocks have driven a lot of the gains in the market over the last few months, outside of the FAANG favorites. The SOX has moved relentlessly higher since its early 2016 low. But is it time for a dip to follow that advance in the chips? The chart below suggests there is still a lot of room to run.
This chart shows the monthly price action for the Semiconductor Index over the past 20 years. There are 5 items of note on the chart. The first is the Shark harmonic pattern playing out. The two triangles show the extent of the pattern, with its Potential Reversal Zone (PRZ) at 1175. This would be a 88.6% retracement of the drop from the tech-bubble high to its low. But the Shark also has the potential to extend to a 1.13% retracement. That would give a PRZ II at 1440. Either one still leaves upside.
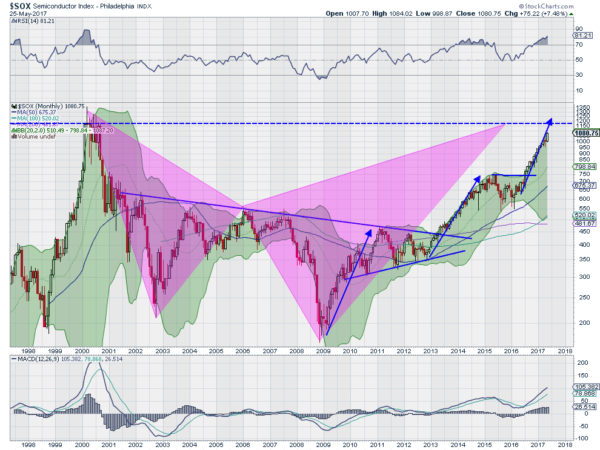
The second item to note is the 3-Drives pattern that has been playing out since the 2009 low. Less noticeable from the log scale on the chart, the legs higher have been 161.8% extensions of the previous leg. This would put the pattern completion at 1240, right between the two PRZs of the Shark from above. The dotted line marks the top of the 2000 high area (when you remove the intra-month spikes that retraced) like a long term resistance. That's the third item. It sits at 1190.
The last two items mark the momentum in the Index. The RSI at the top of the chart is running very hot. A reading over 80 shows strong momentum on the monthly chart and that's just what we have seen in the Index. Rather than being an overbought signal, it's a sign of strength. And it has been higher than this for longer. The MACD at the bottom of the chart gives some perspective. It is higher than it has been in 16 years, but is still far short of the peak in 2000. there is room to move higher.
Semiconductors could be on the last legs of a move higher. But there is still room for that leg to move a lot higher before any indication of a reversal. Wait for confirmation and enjoy the ride.

Trading in financial instruments and/or cryptocurrencies involves high risks including the risk of losing some, or all, of your investment amount, and may not be suitable for all investors. Prices of cryptocurrencies are extremely volatile and may be affected by external factors such as financial, regulatory or political events. Trading on margin increases the financial risks.
Before deciding to trade in financial instrument or cryptocurrencies you should be fully informed of the risks and costs associated with trading the financial markets, carefully consider your investment objectives, level of experience, and risk appetite, and seek professional advice where needed.
Fusion Media would like to remind you that the data contained in this website is not necessarily real-time nor accurate. The data and prices on the website are not necessarily provided by any market or exchange, but may be provided by market makers, and so prices may not be accurate and may differ from the actual price at any given market, meaning prices are indicative and not appropriate for trading purposes. Fusion Media and any provider of the data contained in this website will not accept liability for any loss or damage as a result of your trading, or your reliance on the information contained within this website.
It is prohibited to use, store, reproduce, display, modify, transmit or distribute the data contained in this website without the explicit prior written permission of Fusion Media and/or the data provider. All intellectual property rights are reserved by the providers and/or the exchange providing the data contained in this website.
Fusion Media may be compensated by the advertisers that appear on the website, based on your interaction with the advertisements or advertisers.