Seeking The Highest Option Premiums Is A Losing Strategy
Dr. Alan Ellman | Feb 11, 2018 01:27AM ET
One of the common mistakes made by covered call writers and put-sellers is to make investment decisions based primarily on the highest premium returns. Certainly, we all want to generate the highest levels of success but only when factoring in the risk we will be incurring. This article will look at high premium returns from the perspective of the underlying security as well as from the perspective of the “moneyness” of an out-of-the-money strike .
Time value profit and implied volatility of the underlying security
Our implied volatility of the underlying security. This means that the higher the percentage return, the greater the downside risk. Generally, implied volatility (IV) statistics are based on a 1-year time frame and 1 standard deviation (accurate two-thirds of the time). If a stock shows an implied volatility of 25% and is trading at $60.00, the expected price range over the next year would be between $45.00 and $75.00, 67% of the time. Another $60.00 stock with an implied volatility of 10% would have an anticipated price range of $54.00 to $66.00. There is no need to look up or calculate implied volatility stats because we can glean the degree of risk by looking at our option returns based on our cost basis. I set a goal for initial 1-month returns for near-the-money strikes of 2-4% per month. I will go a bit higher in bull market environments (up to 6%). In my mother’s more conservative portfolio, I set a goal of 1-2% for 1-month returns. Below is a screenshot of a section of the BCI Premium ETF Report for exchange-traded funds. Pages 7-8 shows the implied volatilities which can be compared to that of the overall market (S&P 500):
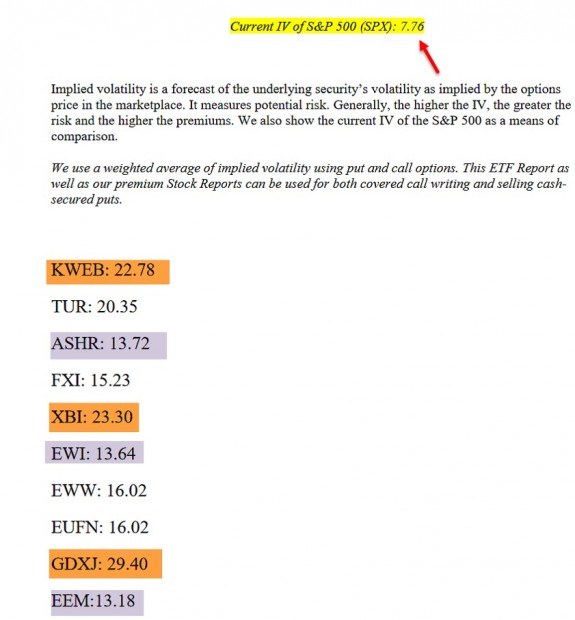
Implied Volatilities from the BCI Premium ETF Report
With the IV of the S&P 500 at 7.76 (red arrow), the screenshot shows some ETFs having slightly less than double that implied risk (purple) and some triple to quadruple the risk (brown) of the S&P 500. Investors with a low risk-tolerance will tend to avoid securities like Deutsche X-trackers Harvest CSI 300 China A-Shares (NYSE:ASHR), iShares MSCI Italy Capped (NYSE:EWI) and iShares MSCI Emerging Markets (NYSE:EEM).
“Moneyness” of out-of-money strikes
When we are bullish on the market and on a specific stock, we favor out-of-the-money strikes which generate time value returns and allow for additional share appreciation up to the strike price. Frequently investors will simply decide based on the strike that is above but closest to current market value. These strikes will tend to generate the highest initial returns but offer little or no opportunity to take advantage of share appreciation. In August 2017, Exact Sciences Corp. was trading at $38.66 and we viewed an option chain for the $39.00, $40.00 and $41.00 out-of-the-money strikes. Here are the calculations generated by the multiple tab of the Ellman Calculator:
Looking at the return-on-option column (ROO), the 5.0% ROO for the $39.00 strike seems like the best choice. However, if we look at the “Upside Potential” column (highlighted in yellow) we see additional opportunities to generate cash. The deeper out-of-the-money strikes offer lower ROOs but higher upside. In a firm bull market, we have an opportunity to generate a 1-month return of 8.6% (2.5% + 5.1%) for the $41.00 strike whereas the $39.00 strike will generate a maximum of 5.9% (5.0% + 0.9%).
This is a valuable instructive scenario as the IV of the underlying is similar for the 3 strikes and Theta (time value erosion) will also be comparable for all 3 strikes but yet the premiums are different. This relates to Delta which will be different for each strike. Near-the-money strikes have higher Deltas than deeper out-of-the-money strikes and this accounts for the price difference. Implied volatility is a critical factor in our covered call writing decisions but not the only factor.
Discussion
Implied volatility is a factor we must consider when evaluating the underlying securities we choose. Each investor should set a percentile range for initial returns based on overall market assessment (bearish to bullish), personal risk-tolerance and chart technicals. IV is a critical but not the only factor that determines our option premiums.
Market tone
- Jay Powell sworn in as Fed chair
- Markit services PMI Jan 53.3 (expansion)
- ISM non-manufacturing index Jan 59.9% (above expectations)
- Foreign trade deficit Dec $53.1 billion (above expectations)
- Consumer credit Dec $18 billion (last $31 billion)
THE WEEK AHEAD
Mon Feb 12th
- Fed budget Jan
Tue Feb 13th
- Household debt Q4
Wed Feb 14th
- Consumer price index Jan
- Retail sales Jan
Thu Feb 15th
- Weekly jobless claims through 2/10
- Industrial production Jan
- NAHB homebuilders index Feb
Fri Feb 16th
- Housing starts Jan
- Building permits Jan
- Consumer sentiment Feb
For the week, the S&P 500 declined by 5.16% for a year-to-date return of (-) 2.02%%
Summary
IBD: Market icorrection
GMI: 1/6- Sell signal since market close of February 7, 2018
BCI: Due to the market volatility, I will be selling only in-the-money calls until market volatility subsides. I remain bullish on the economy and the market moving forward.
WHAT THE BROAD MARKET INDICATORS (S&P 500 AND VIX) ARE TELLING US
The 6-month charts point to a slightly bearish outlook. In the past six months, the S&P 500 was up 6% while the VIX (29.06) moved up by 160%.
Wishing you much success,
Original post
Trading in financial instruments and/or cryptocurrencies involves high risks including the risk of losing some, or all, of your investment amount, and may not be suitable for all investors. Prices of cryptocurrencies are extremely volatile and may be affected by external factors such as financial, regulatory or political events. Trading on margin increases the financial risks.
Before deciding to trade in financial instrument or cryptocurrencies you should be fully informed of the risks and costs associated with trading the financial markets, carefully consider your investment objectives, level of experience, and risk appetite, and seek professional advice where needed.
Fusion Media would like to remind you that the data contained in this website is not necessarily real-time nor accurate. The data and prices on the website are not necessarily provided by any market or exchange, but may be provided by market makers, and so prices may not be accurate and may differ from the actual price at any given market, meaning prices are indicative and not appropriate for trading purposes. Fusion Media and any provider of the data contained in this website will not accept liability for any loss or damage as a result of your trading, or your reliance on the information contained within this website.
It is prohibited to use, store, reproduce, display, modify, transmit or distribute the data contained in this website without the explicit prior written permission of Fusion Media and/or the data provider. All intellectual property rights are reserved by the providers and/or the exchange providing the data contained in this website.
Fusion Media may be compensated by the advertisers that appear on the website, based on your interaction with the advertisements or advertisers.