Seasonality: Stocks And The USD
Callum Thomas | Sep 29, 2017 10:05AM ET
As I write this article the S&P 500 is up 1.4% month to date, with a max drawdown of -0.6%, which makes for a relatively joyful experience in September despite the previously mentioned sinister seasonality that typifies the historical averages for that month. Hence the weird title "what doesn't go down must go up" - and while seasonality didn't "work" in September, it's worth highlighting that the final months of the year are typified by positive seasonality 'on average.' If you're happy with that then stop reading, and if you're waiting for the 'but' then proceed to the next paragraph.
Wildcard Month
October, as the sinister seasonality statistics article showed, while on average seeing positive returns also has the honor of having the highest best and the lowest worst return on record, and saw the largest standard deviation. In other words, historically October can be a wildcard month. This becomes interesting when you think about the wrangling for reforms in American politics (healthcare, tax cuts/reforms), the likelihood of more North Korea escalation, and the launch of Quantitative Tightening.
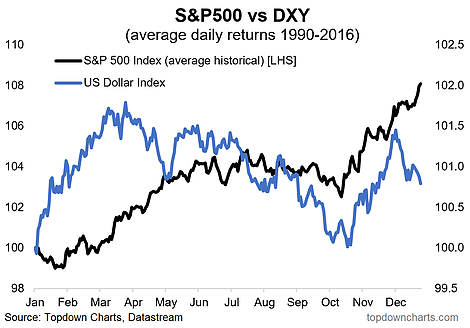
On that last note I turn the attention to the second chart, which shows that the historical pattern is the US dollar gets its second wind about this time of the year. This only adds to an interesting mix of moving parts as many asset classes are moving through important transition points. So, asset alligators beware for scares as the 31st of October approaches.
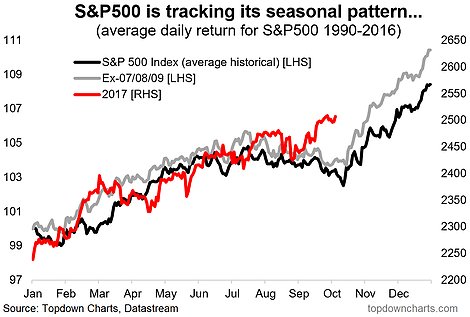
This chart shows the S&P 500 through 2017 YTD against the average seasonal pattern including and excluding the financial crisis, across the year 1990-2016. It seems to be walking a familiar path.
Comparing the average seasonal tendency of the US Dollar Index and the S&P 500, there's an interesting pattern where both assets get their second wind around this time of the year.
Trading in financial instruments and/or cryptocurrencies involves high risks including the risk of losing some, or all, of your investment amount, and may not be suitable for all investors. Prices of cryptocurrencies are extremely volatile and may be affected by external factors such as financial, regulatory or political events. Trading on margin increases the financial risks.
Before deciding to trade in financial instrument or cryptocurrencies you should be fully informed of the risks and costs associated with trading the financial markets, carefully consider your investment objectives, level of experience, and risk appetite, and seek professional advice where needed.
Fusion Media would like to remind you that the data contained in this website is not necessarily real-time nor accurate. The data and prices on the website are not necessarily provided by any market or exchange, but may be provided by market makers, and so prices may not be accurate and may differ from the actual price at any given market, meaning prices are indicative and not appropriate for trading purposes. Fusion Media and any provider of the data contained in this website will not accept liability for any loss or damage as a result of your trading, or your reliance on the information contained within this website.
It is prohibited to use, store, reproduce, display, modify, transmit or distribute the data contained in this website without the explicit prior written permission of Fusion Media and/or the data provider. All intellectual property rights are reserved by the providers and/or the exchange providing the data contained in this website.
Fusion Media may be compensated by the advertisers that appear on the website, based on your interaction with the advertisements or advertisers.