S&P 500: All Systems Go On the Follow-Through
Dr. Duru | Mar 27, 2012 03:58AM ET
: 62%
VIX Status: 14.3%
General (Short-term) Trading Call: Hold with a bullish bias
Reference Charts (click for view of last 6 months from Stockcharts.com):
Commentary
So much for wiping out the gains from the S&P 500′s big breakout on March 13th. In How To Assess Best Buy’s Post-Earnings Potential .”
Ended the torture of holding VXX shares
Nothing has been more destructive to my performance than VXX shares. I finally gave myself MAJOR relief by unloading them on Friday. I simply could not trade VXX puts fast enough to keep up with VXX’s losses. I replaced the shares with April calls that I am holding as “just in case” we wake up one morning to something truly crazy. I suspect there are still way too many bears that are doubling and tripling down on VXX waiting for just that magical (Black swan) moment. I married the calls to even more puts, the better risk/reward bet for now. Those puts soared in value at Monday’s open as VXX quickly fell another 6% to fresh all-time lows. I happily sold them. VXX ended the day down over 9%. This thing got so ugly, I decided near the close to apply some of my profits from the March weekly puts into buying out-of-the-money April puts. VXX’s chart exclaims 1000 words and death by 2000 cuts.
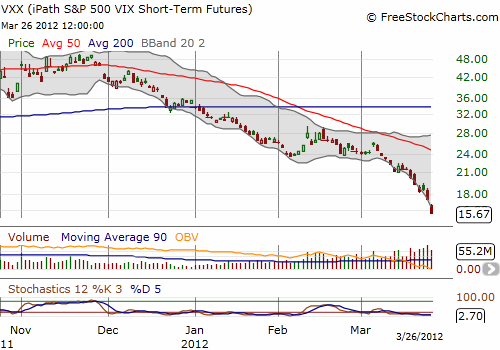
The VXX deathmarch
Back into the euro-plays with Siemens (SI)
The euro-plays get me the most excited right now. They are more in my contrarian comfort zone whereas the bullish plays on the S&P 500 are all about trend-following. With Europe rallying overnight, I checked in on Siemens (SI) to see how far it had popped. To my surprise, Siemens was flat. For comparison, EWG, the Germany ETF, closed the day up a cool 2.2%. SI is still directly below critical resistance so I am taking a larger risk than usual, but I feel it is worth the shot with EWG looking ready to launch to fresh 8-month highs. I consider Siemens a classic “catch-up” stock as it will be a natural play for anyone wanting to participate in a European recovery. I started with calls. If Siemens manages to drop below $90 or so, I will begin accumulating shares to hold for the longer haul.
What now?
With the S&P 500 at fresh multi-year highs, it seems crazy to maintain such a bullish bias, yet, the data told me to do it. While I suspect tomorrow’s open will make me wish I still had all my SSO calls and original collection of VXX puts, I will stay focused on the current strategy of buying whatever dips the market presents and then selling into the next rally. I continue to expect a lot of churn with a slight upward bias that produces numerous bullish trading opportunities, including shifts in and out of overbought territory. Last week’s dip was a PERFECT example of what I talked about earlier as part of my expectations: the continued frustration of bears as selling lacks the critical follow-through to break down the S&P 500. This week’s open printed an exclamation point as the S&P 500 recaptured ALL of last week’s losses in a flash. That impressive move occurred on decent (meaning average) trading volume. This follow-through and fresh breakout must thus be respected and given its due…
When T2108 next hits overbought territory, I hope to re-examine the data supporting the bullish case. Until then, stay nimble and keep an open mind.
Charts below are the latest snapshots of T2108 (and the S&P 500) Refresh browser if the charts are the same as the last T2108 update.
Black line: T2108 (measured on the right); Green line: S&P 500 (for comparative purposes)
Be careful out there!
Full disclosure: long SDS and FXP; long SSO and SI calls; long VXX calls and puts
Trading in financial instruments and/or cryptocurrencies involves high risks including the risk of losing some, or all, of your investment amount, and may not be suitable for all investors. Prices of cryptocurrencies are extremely volatile and may be affected by external factors such as financial, regulatory or political events. Trading on margin increases the financial risks.
Before deciding to trade in financial instrument or cryptocurrencies you should be fully informed of the risks and costs associated with trading the financial markets, carefully consider your investment objectives, level of experience, and risk appetite, and seek professional advice where needed.
Fusion Media would like to remind you that the data contained in this website is not necessarily real-time nor accurate. The data and prices on the website are not necessarily provided by any market or exchange, but may be provided by market makers, and so prices may not be accurate and may differ from the actual price at any given market, meaning prices are indicative and not appropriate for trading purposes. Fusion Media and any provider of the data contained in this website will not accept liability for any loss or damage as a result of your trading, or your reliance on the information contained within this website.
It is prohibited to use, store, reproduce, display, modify, transmit or distribute the data contained in this website without the explicit prior written permission of Fusion Media and/or the data provider. All intellectual property rights are reserved by the providers and/or the exchange providing the data contained in this website.
Fusion Media may be compensated by the advertisers that appear on the website, based on your interaction with the advertisements or advertisers.