S&P 500 Snapshot: Message To The Fed?
Doug Short | Mar 11, 2015 01:23AM ET
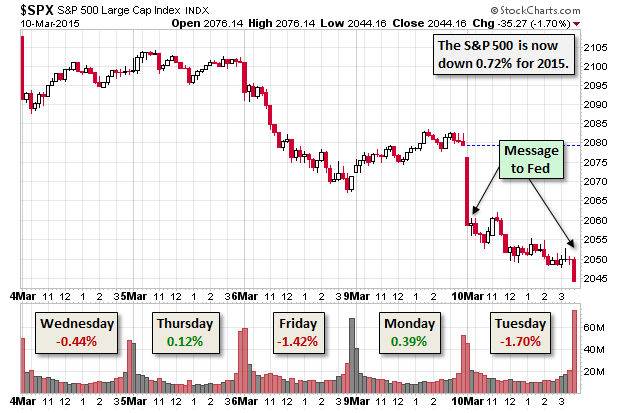
The US equity markets took a beating today. The benchmark S&P 500 plunged at the open and sold off through the day to close at its intraday low at -1.70%. This was the worst daily decline since January 5th. Also, it puts the index in the red year-to-date, down 0.72%, and 3.46% off its record close six sessions ago on March 3rd.
The pundits variously blame dollar strength and anxieties about a rate hike from the Fed. Either way, the market is apparently sending a message to the Fed in advance of its March meeting next week.
The yield on the 10-year note closed at 2.14%, down 6 bps from yesterday's close.
Here is a 15-minute chart of the last five sessions.
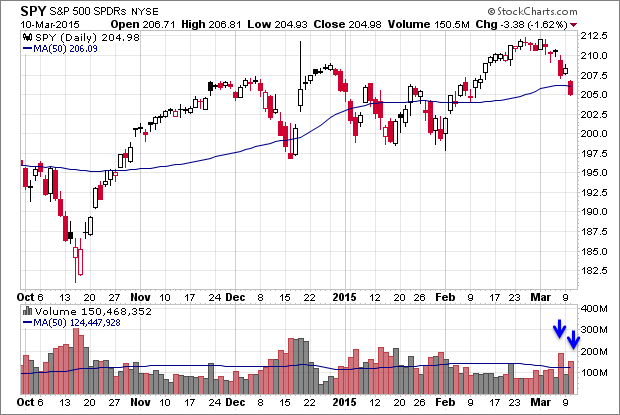
Here's a daily chart of the SPDR S&P 500 (ARCA:SPY) ETF, which give us a sense of investor participation. Volume spiked on today's selloff, but not as much as in the Friday decline.
A Perspective on Drawdowns
Here's a snapshot of selloffs since the 2009 trough.
For a longer-term perspective, here is a pair of charts based on daily closes starting with the all-time high prior to the Great Recession.
Trading in financial instruments and/or cryptocurrencies involves high risks including the risk of losing some, or all, of your investment amount, and may not be suitable for all investors. Prices of cryptocurrencies are extremely volatile and may be affected by external factors such as financial, regulatory or political events. Trading on margin increases the financial risks.
Before deciding to trade in financial instrument or cryptocurrencies you should be fully informed of the risks and costs associated with trading the financial markets, carefully consider your investment objectives, level of experience, and risk appetite, and seek professional advice where needed.
Fusion Media would like to remind you that the data contained in this website is not necessarily real-time nor accurate. The data and prices on the website are not necessarily provided by any market or exchange, but may be provided by market makers, and so prices may not be accurate and may differ from the actual price at any given market, meaning prices are indicative and not appropriate for trading purposes. Fusion Media and any provider of the data contained in this website will not accept liability for any loss or damage as a result of your trading, or your reliance on the information contained within this website.
It is prohibited to use, store, reproduce, display, modify, transmit or distribute the data contained in this website without the explicit prior written permission of Fusion Media and/or the data provider. All intellectual property rights are reserved by the providers and/or the exchange providing the data contained in this website.
Fusion Media may be compensated by the advertisers that appear on the website, based on your interaction with the advertisements or advertisers.