Reverse Splits Start to Moderate After Hitting a Record High in Q1 2025
Christine Short | Jun 09, 2025 12:21PM ET
-
Reverse stock splits, possibly indicating corporate distress, hit a 10-year high in Q1 2025
-
The reverse-to-traditional split ratio also surged in Q1 2025
-
This trend began to taper in May, suggesting improving corporate health
As we head into the second half of the year, US markets seem to be turning around, with economic data that is still coming in mixed. The major US indices were up the first three days of last week, dipping on Thursday after weaker back-to-back readings of the US labor market.
The ADP report showed private payrolls added just 37,000 jobs in May, well below the Dow Jones consensus for 110,000. The following day, initial jobless claims for the prior week came in at 247,000, compared to the consensus estimate of 236,000 from economists polled by Dow Jones. On Friday markets were relieved by a more uplifting Nonfarm Payrolls report that came in at 139,000, higher the estimate for 125,000, but lower than April’s 147,000. Unemployment remained unchanged at 4.2%. Even consumer confidence as tracked by The Conference Board, saw its highest reading in May after five consecutive months of declines. Certain corporate events seem to be following suit.
Reading the Tea Leaves of Corporate Health through Stock Splits
A good read on overall corporate health can be found in reviewing splits data, and the ratio of reverse-to-traditional splits. Reverse splits consolidate the number of existing shares, therefore making them higher-priced, companies often do this when their stock price has dropped dramatically and they are in danger of being de-listed from an exchange. On the other hand, traditional splits increase the number of shares in the marketplace, which lowers the price of each share. Companies typically do this when their stock price has catapulted to record levels which make it unaffordable to retail investors. They would employ a traditional split to increase liquidity and make their shares more accessible.
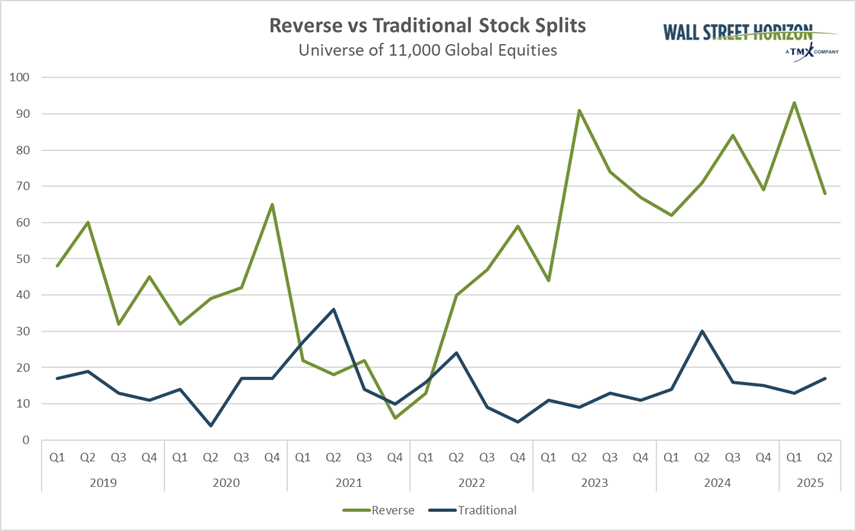
Q1 2025 Recorded the Largest Number of Reverse Splits in a Decade
Q1 2025 had the highest number of reverse stock splits in nearly 10 years, coming in at 93. That trend continued in April when 37 companies announced reverse splits, the second highest monthly total in our data history going back to 2016. Economic headwinds such as fluctuating trade policy and softening consumer spending lead US markets to dip in the first quarter. By early April, the DJIA was down 12%, the S&P 500® fell 15% and the Nasdaq was down over 20%. Many companies performing these reverse splits saw their stock price fall dramatically and did this as a way to boost that price.
The good news is the reverse split trend started to taper in May with 30 such splits announced, more on trend with typical recent monthly totals. We’re only a few days into June at this point, but there are 2 reverse splits thus far.
Source: Wall Street Horizon
Not only are reverse split totals high thus far in 2025, but so is the reverse-to-traditional split ratio. In the last decade that ratio has averaged 3.43, meaning for every one traditional split there were slightly more than three reverse splits. In Q1 2025 that ratio hit 7.15, falling to 4.05 so far in Q2. That’s still historically high but showing signs of reverting back towards the norm.
The Bottom-line
We’ll be keeping our eye on what corporate events are signaling to us about economic conditions as the second half of 2025 approaches. These events and often their timing can be imperative to learning more about the health of companies and the current macro landscape. Reverse splits are just one example of a corporate action companies can take to bear the brunt of a whipsawing markets like we saw earlier this year.
Trading in financial instruments and/or cryptocurrencies involves high risks including the risk of losing some, or all, of your investment amount, and may not be suitable for all investors. Prices of cryptocurrencies are extremely volatile and may be affected by external factors such as financial, regulatory or political events. Trading on margin increases the financial risks.
Before deciding to trade in financial instrument or cryptocurrencies you should be fully informed of the risks and costs associated with trading the financial markets, carefully consider your investment objectives, level of experience, and risk appetite, and seek professional advice where needed.
Fusion Media would like to remind you that the data contained in this website is not necessarily real-time nor accurate. The data and prices on the website are not necessarily provided by any market or exchange, but may be provided by market makers, and so prices may not be accurate and may differ from the actual price at any given market, meaning prices are indicative and not appropriate for trading purposes. Fusion Media and any provider of the data contained in this website will not accept liability for any loss or damage as a result of your trading, or your reliance on the information contained within this website.
It is prohibited to use, store, reproduce, display, modify, transmit or distribute the data contained in this website without the explicit prior written permission of Fusion Media and/or the data provider. All intellectual property rights are reserved by the providers and/or the exchange providing the data contained in this website.
Fusion Media may be compensated by the advertisers that appear on the website, based on your interaction with the advertisements or advertisers.