Returns For Alternative Energy Stocks Vary Widely This Year
James Picerno | Jun 30, 2021 07:52AM ET
Energy stocks are having a good year, or so it seems by using the usual suspects as a benchmark. Traditional names, such as, Exxon Mobil (NYSE:XOM) and Chevron (NYSE:CVX), for example, have posted sharp rallies after suffering in 2020. The wider world for so-called alternative energy, by contrast, is a mixed bag in 2021.
A broad measure of energy shares are posting a wide range of year-to-date performances, based on a set of exchange traded funds tracking several slices of the alternative energy world. (“Alternative” here is defined as companies outside the realm of major oil and gas firms.)
On the plus side,
In second- and third-place: VanEck Vectors Unconventional Oil & Gas ETF (NYSE:FRAK) and SPDR® S&P Oil & Gas Exploration & Production ETF (NYSE:XOP), respectively.
The top-three have outperformed the energy benchmark—Energy Select Sector SPDR® Fund (NYSE:XLE)—by wide margins so far in 2021. XLE’s holdings are dominated by Exxon, Chevron, ConocoPhillips (NYSE:COP) and other large energy companies. The outperformance is no trivial matter when you consider that XLE, year-to-date, is up a strong 43.3%.
Overall, most energy stocks are posting gains; the main exceptions are found in clean energy industries.
The worst performer on our list: iShares Global Clean Energy ETF (NASDAQ:ICLN). After a powerful rally in 2020, ICLN has been retreating this year and is currently down a bit more than 15% in 2021 through yesterday’s close.
Year-to-date losses are found in four other energy funds on our list—ETFs tracking companies focused on solar via Invesco Solar ETF (NYSE:TAN), US clean energy, via Invesco WilderHill Clean Energy ETF (NYSE:PBW), wind energy, via First Trust Global Wind Energy ETF (NYSE:FAN), and renewable energy/low-carbon stocks, by VanEck Vectors Low Carbon Energy ETF (NYSE:SMOG).
Although some corners of green energy stocks are suffering this year, investors still appear willing to bet aggressively on these industries, based on fund flows. The Wall Street Journal this week reports that “Clean Energy ETFs Take a Hit, but Money Keeps Flowing In.”
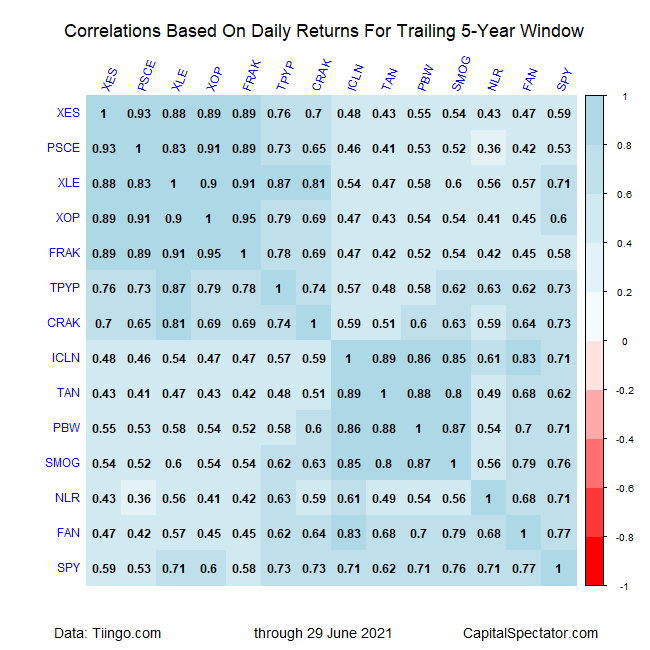
Here’s a complete listing of the ETFs and tickers cited in the chart above, followed by a table of return correlations of the funds.
Trading in financial instruments and/or cryptocurrencies involves high risks including the risk of losing some, or all, of your investment amount, and may not be suitable for all investors. Prices of cryptocurrencies are extremely volatile and may be affected by external factors such as financial, regulatory or political events. Trading on margin increases the financial risks.
Before deciding to trade in financial instrument or cryptocurrencies you should be fully informed of the risks and costs associated with trading the financial markets, carefully consider your investment objectives, level of experience, and risk appetite, and seek professional advice where needed.
Fusion Media would like to remind you that the data contained in this website is not necessarily real-time nor accurate. The data and prices on the website are not necessarily provided by any market or exchange, but may be provided by market makers, and so prices may not be accurate and may differ from the actual price at any given market, meaning prices are indicative and not appropriate for trading purposes. Fusion Media and any provider of the data contained in this website will not accept liability for any loss or damage as a result of your trading, or your reliance on the information contained within this website.
It is prohibited to use, store, reproduce, display, modify, transmit or distribute the data contained in this website without the explicit prior written permission of Fusion Media and/or the data provider. All intellectual property rights are reserved by the providers and/or the exchange providing the data contained in this website.
Fusion Media may be compensated by the advertisers that appear on the website, based on your interaction with the advertisements or advertisers.