Retest of the 200-Day Moving Average Isn't Bearish—Unless It Fails
Dan Sheehan | Jun 06, 2025 12:45AM ET
The 200-day moving average (MA) is more than just a line on a chart. It's one of the most widely watched technical indicators on Wall Street—a long-term trend filter that helps investors separate short-term noise from genuine directional shifts in the market. When markets are trading above the 200-day MA, they're typically considered to be in a bull trend. Conversely, extended breaks below the 200-day MA tend to signal broader weakness and risk of trend reversal.
But within an ongoing bull market, pullbacks to the 200-day MA are not only common—they're often healthy. They provide an opportunity to reset overly stretched conditions and reinforce trend support. In that sense, a test of the 200-day MA should not be viewed as inherently bearish. It becomes a problem only if it fails to hold.
Where We Are Now
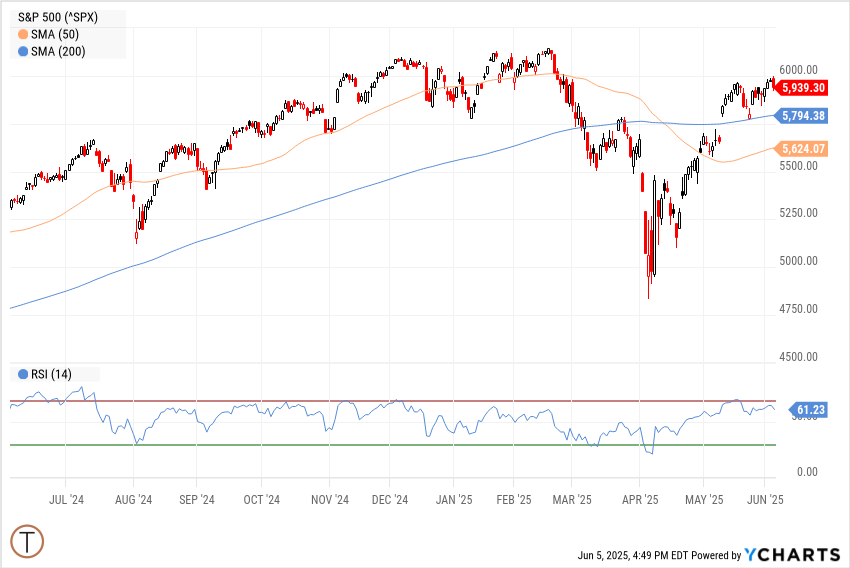
As of the most recent close, the S&P 500 closed at 5,939, trading comfortably above both its 200-day simple moving average at 5,794 (2.5% below current levels) and its 200-day exponential moving average at 5,683 (4.5% below current levels). The Nasdaq closed at 21,551, positioned well above both its 200-day SMA at 20,412 (5.6% below) and 200-day EMA at 20,073 (7.4% below). These cushions provide markets with some room to breathe, but also leave the door open for a healthy pullback that could test these key moving average support levels.
That rebound was notable: following a March selloff that saw the S&P 500 break below its 200-day MA on March 7th, the index found support and bounced off this key level on March 26th—just days before the April 2nd tariff announcement that initially sparked further volatility. This successful defense of the 200-day MA during the March-April period provides a recent example of how this technical level can act as dynamic support during bull market corrections. With bond yields inching higher again and macro uncertainty returning—thanks to U.S. fiscal policy, global trade tensions, and sovereign concerns—the prospect of another pullback can't be ignored. But context is critical.
The Statistical Reality of Market Corrections
Before diving into the technical significance of the 200-day MA, it's worth understanding just how normal corrections are. Historical data reveals that roughly 50% of calendar years experience a pullback of at least 10%, with an average correction depth of 15%. Since 2020 alone, we've witnessed multiple corrections: five separate 10%+ pullbacks in 2020, zero in 2021 (a rare occurrence), four corrections in 2022, and one in 2023.
This frequency underscores an important point: corrections aren't aberrations—they're features of healthy bull markets. The question isn't whether we'll see another pullback, but how the market behaves when it arrives.
Historical Precedent: The 200-Day as Dynamic Bull Market Support
History shows that in ongoing bull markets, the 200-day MA acts as a crucial support level, with successful tests occurring roughly 70% of the time during established uptrends. Let's examine some key examples:
The 2011 Debt Ceiling Crisis: In August 2011, amid Washington's debt ceiling standoff, the S&P 500 plunged 18% from its July highs, testing and briefly breaking below its 200-day MA. However, the index found support around the 1,120 level and rallied 29% over the subsequent 12 months, confirming the bull market's continuation.
The 2015-2016 China Slowdown: Between August 2015 and February 2016, concerns about China's economic deceleration and currency devaluation triggered significant volatility. The S&P 500 broke below its 200-day MA during this period, falling as much as 15% from its 2015 highs. The successful reclaim of the 200-day MA in March 2016 marked the beginning of another powerful leg higher, with the index gaining over 20% through 2017.
The 2018 Volatility Surge: The market faced multiple challenges in 2018—rising interest rates, trade war fears, and growth concerns. The S&P 500 tested its 200-day MA in February (down 12% in two weeks), held the level, and bounced back. However, the more significant test came in Q4 2018, when the index broke decisively below the 200-day MA, falling 20% from its September highs. This breakdown proved prescient, as it took until April 2019 for the market to decisively reclaim this key level.
The 2020 Post-COVID Recovery: Perhaps the most dramatic example occurred during the pandemic. After crashing 35% and breaking well below the 200-day MA in March 2020, the S&P 500 began one of history's fastest recoveries. By June 2020, it had reclaimed its 200-day MA, and the subsequent hold of this level during September 2020's tech selloff (a -10% pullback that stopped just above the 200-day MA) confirmed the bull market's resilience.
The 2022 Bear Market Signal: The inverse occurred in 2022, when the Nasdaq's failure to reclaim its 200-day MA over multiple months signaled a genuine trend reversal. This failure, combined with deteriorating breadth and fundamental headwinds, marked the transition from bull to bear market conditions.
Sector-by-Sector Analysis: Not All 200-Day Tests Are Created Equal
Different sectors exhibit varying behavior around their 200-day moving averages, which can provide additional insight:
Technology: Historically the most volatile around the 200-day MA, with tests often coinciding with broader growth concerns. However, successful bounces in tech often signal resumed risk appetite across markets.
Financials: Tend to be more sensitive to interest rate movements, making their 200-day MA tests closely tied to Federal Reserve policy expectations.
Consumer Discretionary: Often reflects broader economic confidence, with successful 200-day MA tests suggesting continued consumer strength.
Utilities and Consumer Staples: These defensive sectors sometimes break above their 200-day MAs when growth sectors are struggling, serving as rotation indicators.
Market Breadth: The Hidden Truth Behind the Averages
While headline indices grab attention, market breadth often tells the real story. Currently, approximately 60% of S&P 500 stocks trade above their individual 200-day moving averages—a healthy reading, though down from March's peak of nearly 75%. Historical analysis shows:
- Above 70%: Typically indicates strong, broad-based bull market conditions
- 50-70%: Suggests selective strength but potential vulnerability
- Below 50%: Often precedes or confirms bear market conditions
The current reading of 60% suggests a market that's healthy but not euphoric—exactly the type of environment where a 200-day MA test might occur and prove constructive.
What to Watch This Time Around
A potential retest of the 200-day MA in the coming months would fall squarely within historical norms. What matters is how the market behaves around it:
Bullish Signals to Monitor:
- High volume on any bounce from the 200-day MA (indicating institutional buying interest)
- Improvement in market breadth during the test (more stocks participating in any recovery)
- Defensive sector underperformance (suggesting continued risk appetite)
- Credit markets remaining stable (corporate bond spreads not widening significantly)
Bearish Warning Signs:
- Multiple failed attempts to hold the 200-day MA
- Deteriorating earnings revisions during the pullback
- Rising correlation across asset classes (suggesting systemic stress)
- Breakdown in sector leadership (particularly technology and consumer discretionary)
The Fundamental Backdrop Matters
Technical analysis works best when supported by fundamental conditions. Currently, the bull case faces a mixed backdrop with both supportive and challenging factors:
Earnings Resilience: S&P 500 companies have shown strength, with Q1 2025 earnings exceeding lowered expectations, particularly in sectors like Health Care, Information Technology, and Communications Services, driven by AI-related capital expenditure. However, growth has moderated, with Goldman Sachs revising 2025 S&P 500 EPS growth forecasts down to 7% from 9% in March 2025, reflecting slower economic activity and tariff impacts.
Federal Reserve Policy: The Fed has maintained a restrictive stance, holding interest rates at 4.25%–4.5% as of late May 2025, despite inflation cooling to 2.1% (PCE). This hawkish policy, driven by tariff uncertainties and potential inflationary pressures, contrasts with the more accommodative conditions that historically supported bull markets. While not as aggressive as the 2022 tightening cycle, the current elevated rates—well above pre-pandemic levels—pose challenges for growth stocks and could pressure valuations if economic growth slows further.
Economic Data: Growth has moderated, with Goldman Sachs cutting its 2025 real GDP growth forecast to 1.7% from 2.2% in March 2025, citing tariffs, uncertainty, and tighter financial conditions. Recession indicators are mixed: while unemployment remains low at 4.2% and growth is solid, warning signals like yield curve inversions and rate-cut bets have emerged. In April 2025, only two major banks (JPMorgan, Barclays) officially called for a recession, but the risk rises if tariffs persist and global retaliation escalates, potentially tipping the U.S. into contraction alongside struggling economies like China and Europe.
Risks to Monitor: Geopolitical tensions, particularly U.S.-China trade disputes, have intensified with tariffs on steel and aluminum, though markets have shown resilience by digesting such news with muted reactions. Policy shifts under the current administration—such as tax cuts, deregulation, and federal workforce reductions—add uncertainty, potentially fueling inflation or growth depending on execution. Elevated valuations remain a concern, with the S&P 500's forward P/E ratio at 20.6x in March 2025, well above the historical median of 17.0x. This makes the market vulnerable to corrections if earnings disappoint or a negative shock occurs.
Investment Strategy Implications
For investors, the key is preparation without paralysis:
For Long-Term Investors: Use any 200-day MA test as a potential opportunity to add quality positions, particularly if accompanied by improved valuations and strong volume on any bounce.
For Tactical Traders: Monitor the technical signals closely, but avoid overreacting to initial tests. History suggests patience is often rewarded.
For Risk Managers: Consider the 200-day MA as one tool among many, not a standalone signal. Combine technical analysis with fundamental research and portfolio context.
Bottom Line
A pullback to the 200-day moving average would not be a surprise—and it wouldn't be bearish unless the market fails to hold that level consistently. Historical precedent suggests that such tests often mark opportunity rather than danger within established bull markets.
The key lies in confirmation: successful defense of the 200-day MA, particularly with improving volume and breadth, typically signals trend continuation. Failure to hold, especially with fundamental deterioration, warrants increased caution.
Until then, let the market breathe—and remember that volatility around key technical levels is often the price of long-term wealth creation. Use the 200-day MA as a tool for discipline, not a trigger for panic.
Trading in financial instruments and/or cryptocurrencies involves high risks including the risk of losing some, or all, of your investment amount, and may not be suitable for all investors. Prices of cryptocurrencies are extremely volatile and may be affected by external factors such as financial, regulatory or political events. Trading on margin increases the financial risks.
Before deciding to trade in financial instrument or cryptocurrencies you should be fully informed of the risks and costs associated with trading the financial markets, carefully consider your investment objectives, level of experience, and risk appetite, and seek professional advice where needed.
Fusion Media would like to remind you that the data contained in this website is not necessarily real-time nor accurate. The data and prices on the website are not necessarily provided by any market or exchange, but may be provided by market makers, and so prices may not be accurate and may differ from the actual price at any given market, meaning prices are indicative and not appropriate for trading purposes. Fusion Media and any provider of the data contained in this website will not accept liability for any loss or damage as a result of your trading, or your reliance on the information contained within this website.
It is prohibited to use, store, reproduce, display, modify, transmit or distribute the data contained in this website without the explicit prior written permission of Fusion Media and/or the data provider. All intellectual property rights are reserved by the providers and/or the exchange providing the data contained in this website.
Fusion Media may be compensated by the advertisers that appear on the website, based on your interaction with the advertisements or advertisers.