Regression To Trend: A Perspective On Long-Term Market Performance
Doug Short | Jul 02, 2015 12:20AM ET
Quick take: At the end of June the inflation-adjusted S&P 500 index price was 91% above its long-term trend, a slight decline from the previous month.
About the only certainty in the stock market is that, over the long haul, over performance turns into under performance and vice versa. Is there a pattern to this movement? Let's apply some simple regression analysis (see footnote below) to the question.
Below is a chart of the S&P Composite stretching back to 1871 based on the real (inflation-adjusted) monthly average of daily closes. We're using a semi-log scale to equalize vertical distances for the same percentage change regardless of the index price range.
The regression trendline drawn through the data clarifies the secular pattern of variance from the trend — those multi-year periods when the market trades above and below trend. That regression slope, incidentally, represents an annualized growth rate of 1.77%.
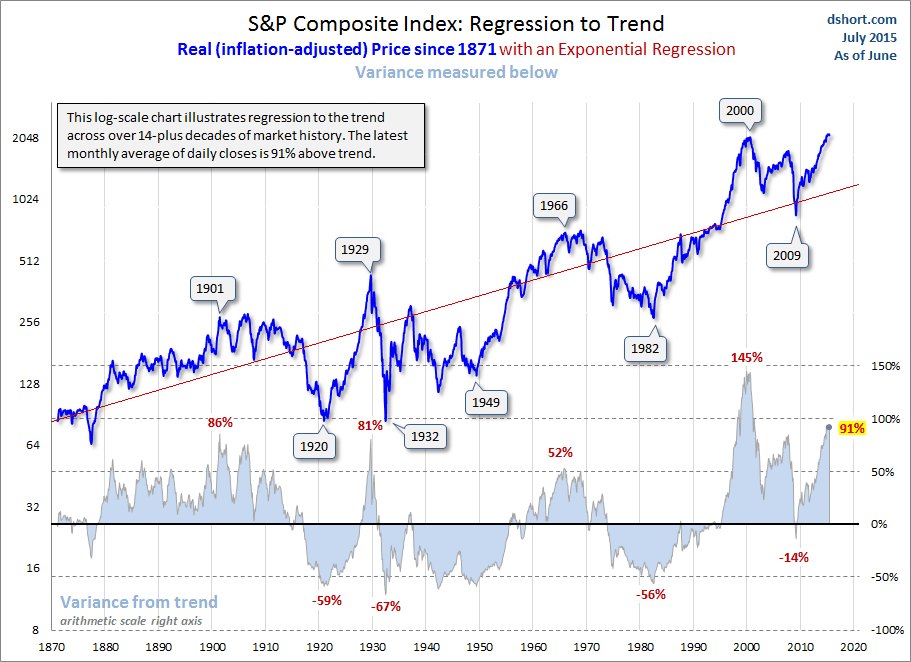
The peak in 2000 marked an unprecedented 146% overshooting of the trend — nearly double the overshoot in 1929. The index had been above trend for two decades, with one exception: it dipped about 13% below trend briefly in March of 2009. But at the beginning of June 2015, it is 94% above trend, up from 93% from the previous month. In sharp contrast, the major troughs of the past saw declines in excess of 50% below the trend. If the current S&P 500 were sitting squarely on the regression, it would be around the 1086 level.
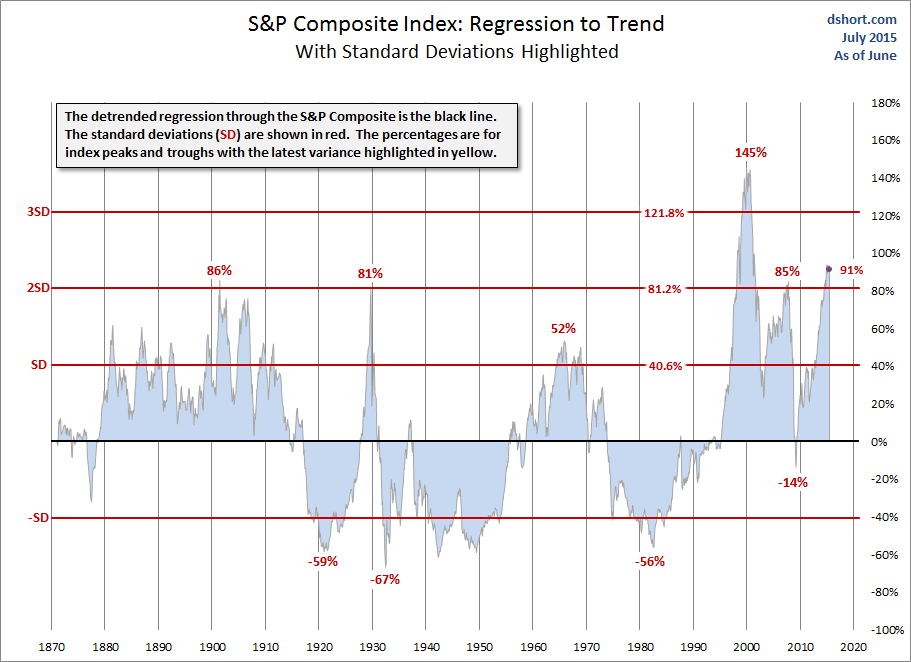
Incidentally, the standard deviation for prices above and below trend is 40.6%. Here is a close-up of the regression values with the regression itself shown as the zero line. We've highlighted the standard deviations. We can see that the early 20th century real price peaks occurred at around the second deviation. Troughs prior to 2009 have been more than a standard deviation below trend. The peak in 2000 was well north of 3 deviations, and the 2007 peak was above the two deviations -- as is our current level.
Footnote on Calculating the Regression: The regression on the Excel chart above is an exponential regression to match the logarithmic vertical axis. We used the Excel Growth function to draw the line. The percentages above and below the regression are the calculated as the real average of daily closes for the month in question divided by the Growth function value for that month minus 1. For example, if the monthly average of daily closes for a given month was 2,000. The Growth function value for the month was 1,000. Thus, the former divided by the latter minus 1 equals 100%.
Footnote on the S&P Composite: For readers unfamiliar with this index, see this article for some background information.
Trading in financial instruments and/or cryptocurrencies involves high risks including the risk of losing some, or all, of your investment amount, and may not be suitable for all investors. Prices of cryptocurrencies are extremely volatile and may be affected by external factors such as financial, regulatory or political events. Trading on margin increases the financial risks.
Before deciding to trade in financial instrument or cryptocurrencies you should be fully informed of the risks and costs associated with trading the financial markets, carefully consider your investment objectives, level of experience, and risk appetite, and seek professional advice where needed.
Fusion Media would like to remind you that the data contained in this website is not necessarily real-time nor accurate. The data and prices on the website are not necessarily provided by any market or exchange, but may be provided by market makers, and so prices may not be accurate and may differ from the actual price at any given market, meaning prices are indicative and not appropriate for trading purposes. Fusion Media and any provider of the data contained in this website will not accept liability for any loss or damage as a result of your trading, or your reliance on the information contained within this website.
It is prohibited to use, store, reproduce, display, modify, transmit or distribute the data contained in this website without the explicit prior written permission of Fusion Media and/or the data provider. All intellectual property rights are reserved by the providers and/or the exchange providing the data contained in this website.
Fusion Media may be compensated by the advertisers that appear on the website, based on your interaction with the advertisements or advertisers.