Rally Leave Chart Trends Still Negative
Guy S. Ortmann, CMT | Sep 23, 2021 09:45AM ET
Insiders Bought Recent Weakness
The majority of the major equity indexes closed mostly higher yesterday except for the DJT posting a loss. Internals were broadly positive on the NYSE and NASDAQ as trading volumes rose from the prior session. While the charts did a few positive technical events, the strength of yesterday’s trading still left all the index charts in near-term downtrends. However, there was some slight improvement in cumulative market breadth while insider buying saw a notable uptick, suggesting they were buyers of the recent market weakness.
The data remains mostly neutral. Our net takeaway is the markets may see some continuation of yesterday’s bounce. Nonetheless, the fact that the charts have violated uptrends that had been intact for the past several months and remain in downtrends suggest the possibility that the current bounce may result in tests of resistance that may fail. Thus, we are keeping our near-term macro-outlook for equities at “neutral/negative.”
On the charts, the only major equity index to post a loss yesterday was the DJT as the rest advanced with positive internals on the NYSE and NASDAQ as trading volumes rose on both exchanges.
- Most closed around the midpoints of their intraday ranges.
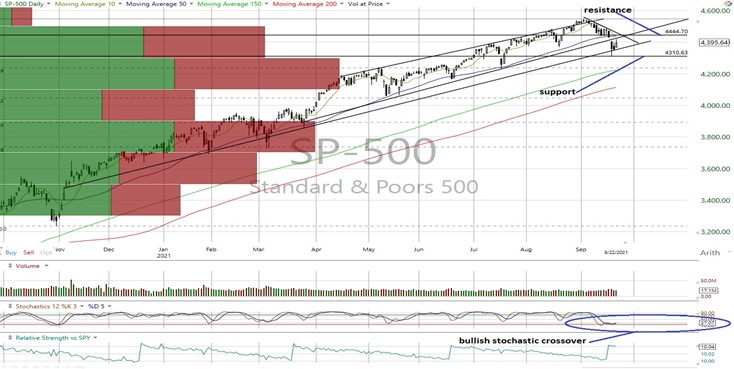
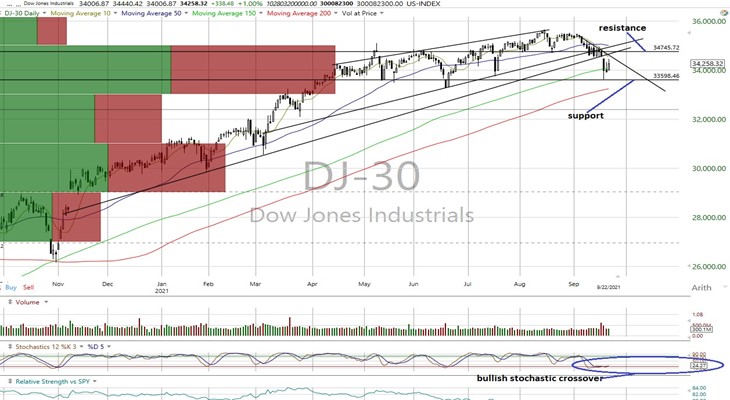
- Yet despite the strength, all the indexes remain in near-term downtrends after violating important uptrends lately. Standard technical analysis theory suggests the longer a trend has been in place, the greater the significance of a violation of said trend.
- Individually, the COMPQX closed back above its 50 DMA while the RTY closed above resistance but remains negative.
- Cumulative market breadth saw some improvement with the A/Ds for the All Exchange and NYSE turning neutral from negative while the NASDAQ’s remains negative.
- Bullish stochastic crossovers were generated on the SPX, DJI, COMPQX, MID and VALUA.
The data finds the McClellan 1-Day OB/OS Oscillators neutral across the board (All Exchange: +3.02 NYSE: -4.31 NASDAQ: +8.26).
- The Rydex Ratio (contrarian indicator) measuring the action of the leveraged ETF traders dipped to 1.03 and remains mildly bearish as the ETF traders have eased up on their leveraged long exposure to some degree.
- However, the Open Insider Buy/Sell Ratio rose significantly to 76.2 as insiders saw the recent decline as a buying opportunity. It remains neutral.
- This week’s contrarian AAII Bear/Bull Ratio (33.27/34.9) and Investors Intelligence Bear/Bull Ratio (22.1/50.0) (contrary indicator) both saw a rise in bears and dip in bulls but remain neutral.
- Valuation finds the forward 12-month consensus earnings estimate from Bloomberg dipping slightly to $206.83 for the SPX. As such, the SPX forward multiple is 21.3 with the “rule of 20” finding fair value at approximately 18.7.
- The SPX forward earnings yield is 4.7%.
- The 10-year Treasury yield rose to 1.34% and remains within its current trading range with resistance at 1.4% and support at 1.23%.
In conclusion, while yesterday’s strength saw an improvement in breadth and insider activity, the recent break of months long trends leaves us near-term “neutral/negative” as rallies to resistance may fail.
SPX: 4,310/4,444 DJI: 33,598/34,745 COMPQX: 14,554/15,013 NDX: 14,836/15,379
DJT: 13,930/14,364 MID: 2,600/2,685 RTY: 2,195/2,235 VALUA: 9,225/9,507
Charts source: Worden
S&P 500
Dow Jones Industrials
NASDAQ Composite
NASDAQ 100
Dow Jones Transports
S&P Midcap 400
Russell 2000 Futures
Trading in financial instruments and/or cryptocurrencies involves high risks including the risk of losing some, or all, of your investment amount, and may not be suitable for all investors. Prices of cryptocurrencies are extremely volatile and may be affected by external factors such as financial, regulatory or political events. Trading on margin increases the financial risks.
Before deciding to trade in financial instrument or cryptocurrencies you should be fully informed of the risks and costs associated with trading the financial markets, carefully consider your investment objectives, level of experience, and risk appetite, and seek professional advice where needed.
Fusion Media would like to remind you that the data contained in this website is not necessarily real-time nor accurate. The data and prices on the website are not necessarily provided by any market or exchange, but may be provided by market makers, and so prices may not be accurate and may differ from the actual price at any given market, meaning prices are indicative and not appropriate for trading purposes. Fusion Media and any provider of the data contained in this website will not accept liability for any loss or damage as a result of your trading, or your reliance on the information contained within this website.
It is prohibited to use, store, reproduce, display, modify, transmit or distribute the data contained in this website without the explicit prior written permission of Fusion Media and/or the data provider. All intellectual property rights are reserved by the providers and/or the exchange providing the data contained in this website.
Fusion Media may be compensated by the advertisers that appear on the website, based on your interaction with the advertisements or advertisers.