Putting The Recent Market Volatility In Context
Doug Short | Feb 04, 2016 11:56PM ET
The increase in market volatility has been a major focus of the popular financial press during the opening weeks of 2016. Let's examine the historical context for market volatility over the past nine-plus years, specifically since January 2007. Our preferred measure of volatility is the daily price range in the S&P 500: The percent change from the intraday low to the intraday high. To illustrate this bit of market behavior, we've charted the intraday range, the red dots in the accompanying chart, along with a 20-day moving average of this measure. To assist us in viewing the correlation with the market, we've overlaid an area chart of the index itself.
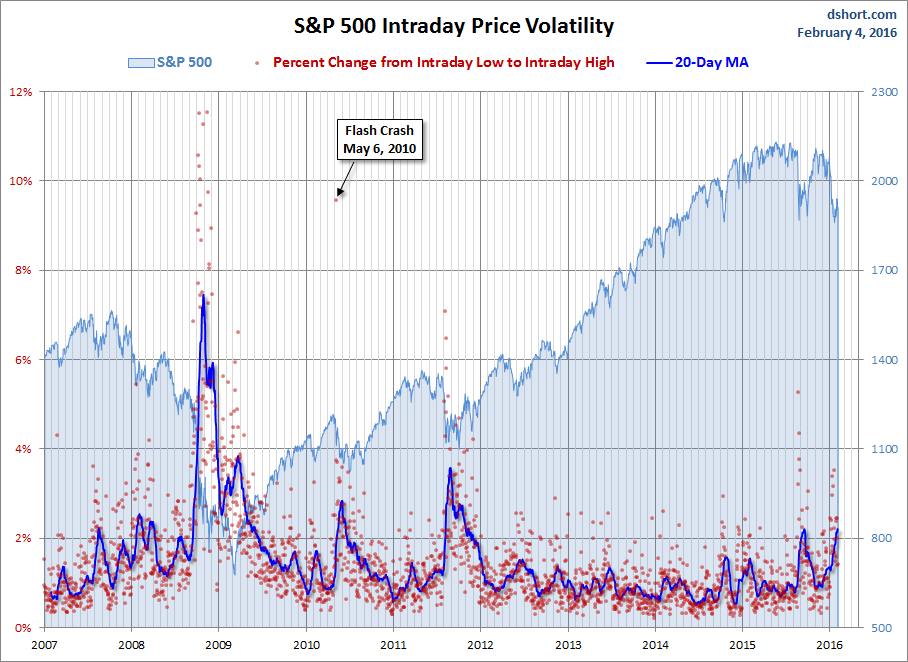
The intraday percent change across the entire timeframe ranges from a low of 0.20% to a high of 11.52%. The average for the 2288 market days charted above is 1.45%.
Since the recovery after the 2009 market low, we saw interim peaks in May of 2010, which preceded the -15.99% correction trough a few weeks later on July 2nd. A higher interim volatility peak occurred in late August of 2011, which preceded a more severe -19.39% correction trough on October 3rd of that year.
At present, the 20-day moving average of the percent change is 2.20%, matching a level in mid-September of last year. This measure of volatility is about where we were August 2007 during the decline between the twin peaks in the S&P 500 preceding the bear market that bottomed at -56.78% at the close on March 9, 2009.
For a better sense of volatility surrounding that 2009 low, here is a snapshot of the data for the calendar years 2008 and 2009.
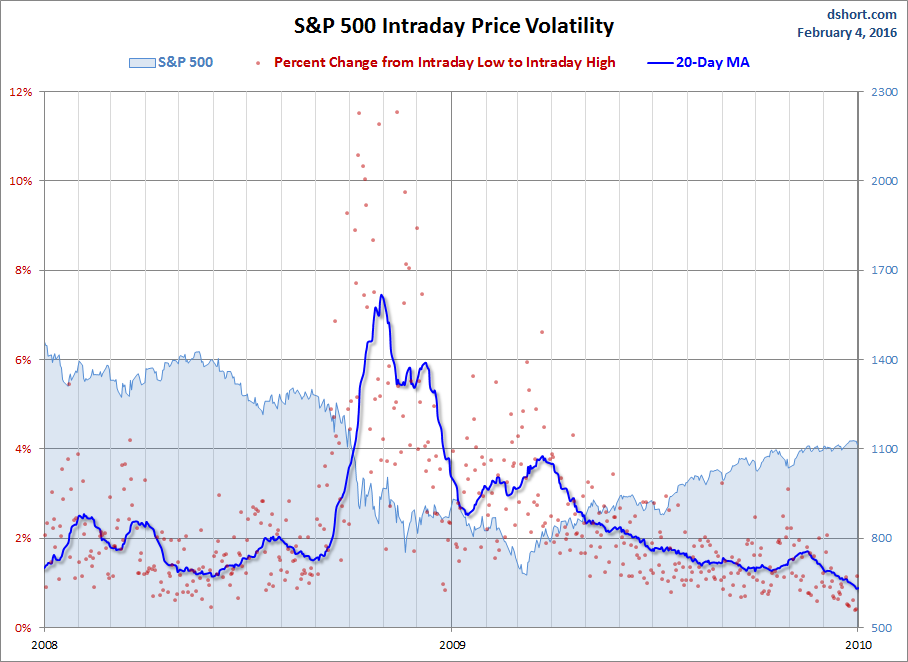
We see that intraday price volatility peaked a bit over four months before the market bottomed. We can also see a much smaller increase in our volatility moving average in the days following the bottom, reflecting no doubt the mixed views about whether the bottom was in.
To reiterate, the latest 20-day moving average of the percent change is 2.20%, about where we were August 2007 during the decline between the twin peaks in the S&P 500 before the savage bear market that followed. The question, of course, is ... Will a further increase in volatility will be correlated with a deeper correction? Or is the worst behind us?
We'll update these charts periodically in the weeks ahead.
Note: For the curious observer, in the first chart above we included a callout for the Flash Crash on May 6th 2010, when the intraday range for the S&P 500 was a stunning 9.55%, and the index plunged 3.24%.
Trading in financial instruments and/or cryptocurrencies involves high risks including the risk of losing some, or all, of your investment amount, and may not be suitable for all investors. Prices of cryptocurrencies are extremely volatile and may be affected by external factors such as financial, regulatory or political events. Trading on margin increases the financial risks.
Before deciding to trade in financial instrument or cryptocurrencies you should be fully informed of the risks and costs associated with trading the financial markets, carefully consider your investment objectives, level of experience, and risk appetite, and seek professional advice where needed.
Fusion Media would like to remind you that the data contained in this website is not necessarily real-time nor accurate. The data and prices on the website are not necessarily provided by any market or exchange, but may be provided by market makers, and so prices may not be accurate and may differ from the actual price at any given market, meaning prices are indicative and not appropriate for trading purposes. Fusion Media and any provider of the data contained in this website will not accept liability for any loss or damage as a result of your trading, or your reliance on the information contained within this website.
It is prohibited to use, store, reproduce, display, modify, transmit or distribute the data contained in this website without the explicit prior written permission of Fusion Media and/or the data provider. All intellectual property rights are reserved by the providers and/or the exchange providing the data contained in this website.
Fusion Media may be compensated by the advertisers that appear on the website, based on your interaction with the advertisements or advertisers.