Profiling Asset Allocation Strategies With Style Analysis
James Picerno | Mar 07, 2018 07:39AM ET
In a series of recent articles I reviewed how here , and here). That’s a powerful application, but it only scratches the surface for productive uses of style analysis. What else can you do? Monitoring asset weights via a broad set of asset allocation funds is one possibility.
Tracking the implied weights through time for dozens or hundreds of asset allocation ETFs and mutual funds offers an intriguing window into how the crowd’s preferences wax and wane for various asset classes. In turn, this information may be valuable for developing insight about market trends and how your strategy compares with decisions in financial industry overall .
As a simple example, let’s run the numbers on three popular asset allocation funds: Vanguard STAR Inv, PIMCO All Asset C, and iShares Core Growth Allocation (NYSE:AOR). In practice, focusing on dozens if not hundreds of funds offers the potential for a more robust set of results, but for purposes of illustration this toy example will suffice.
Once you have a set of funds to analyze, the next key issue is choosing a set of return benchmarks for the style analysis. There are numerous possibilities, depending on your analytical focus. As one example, let’s use a set of ETFs as proxies for the major asset classes.
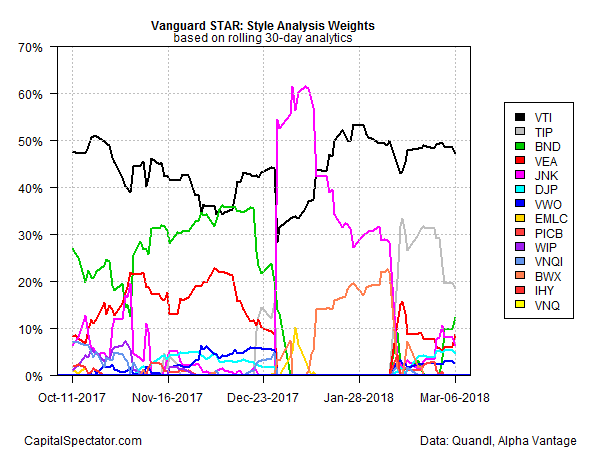
If you have a particular interest in a single fund, style analysis offers a tool for estimating how the asset allocation has evolved through time. The chart below tracks VGSTX’s shifting weights for the major asset classes, based on a rolling 30-day window. One insight that emerges: VGSTX’s exposure to the high-yield-bond risk factor surged in late-2017, but in recent weeks this allocation has dropped sharply (pink line, which tracks JNK). The analytics also indicate that exposure to the broad US equity market has trended up to a relatively high level in recent months at roughly the 50% mark (VTI via the black line).
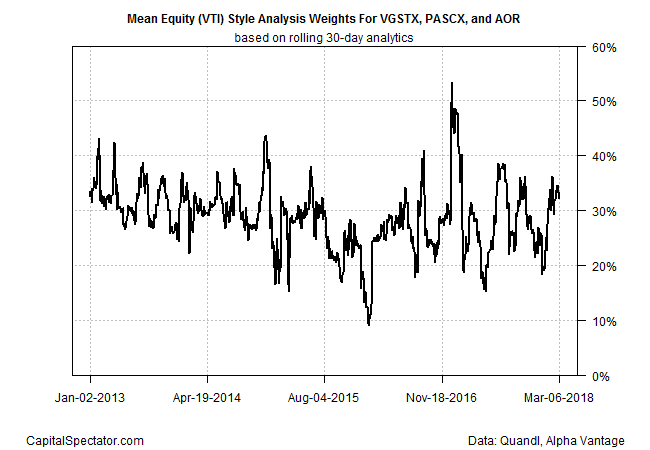
Looking at one fund’s style analysis profile may be useful, but there’s broader perspective available by tracking multiple funds. For simplicity, I’ll focus on three asset allocation products as an example. One application is profiling how the average weight for US equities stacks up through time. For example, in the next chart the mean weight for US equities has popped up to roughly 33% in recent days from just below 20% at the end of 2017.
There are, of course, many ways to customize style analysis to match your specific analytical needs. Because mutual funds and ETFs target virtually every corner of global markets, the sky’s the limit in theory for mining strategic and tactical information via style analysis.
Trading in financial instruments and/or cryptocurrencies involves high risks including the risk of losing some, or all, of your investment amount, and may not be suitable for all investors. Prices of cryptocurrencies are extremely volatile and may be affected by external factors such as financial, regulatory or political events. Trading on margin increases the financial risks.
Before deciding to trade in financial instrument or cryptocurrencies you should be fully informed of the risks and costs associated with trading the financial markets, carefully consider your investment objectives, level of experience, and risk appetite, and seek professional advice where needed.
Fusion Media would like to remind you that the data contained in this website is not necessarily real-time nor accurate. The data and prices on the website are not necessarily provided by any market or exchange, but may be provided by market makers, and so prices may not be accurate and may differ from the actual price at any given market, meaning prices are indicative and not appropriate for trading purposes. Fusion Media and any provider of the data contained in this website will not accept liability for any loss or damage as a result of your trading, or your reliance on the information contained within this website.
It is prohibited to use, store, reproduce, display, modify, transmit or distribute the data contained in this website without the explicit prior written permission of Fusion Media and/or the data provider. All intellectual property rights are reserved by the providers and/or the exchange providing the data contained in this website.
Fusion Media may be compensated by the advertisers that appear on the website, based on your interaction with the advertisements or advertisers.