Possible 2016 U.S. Presidential Election Target For SPX
Candy Matheson | Jul 01, 2016 06:15AM ET
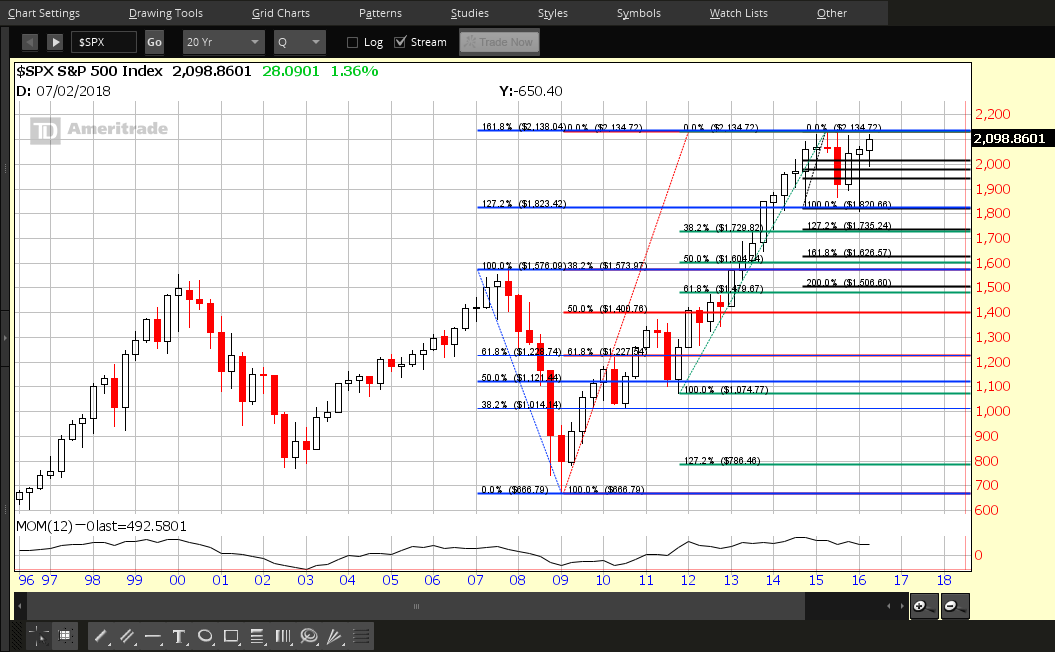
Each candle on the SPX chart below represents 1/4 of one year.
Further to my post of June 27th, and, as shown on the following updated 20-year quarterly chart of the SPX, the 2016 Q2 candle closed today at a higher level than -- on what was a previously potential bearish hanging man -- the Q1 candle. This bearish reversal warning was not confirmed.
Instead, what we're left with, at the moment, is a wide-range high-base consolidation for the past 6 quarters, with price now near all-time highs.
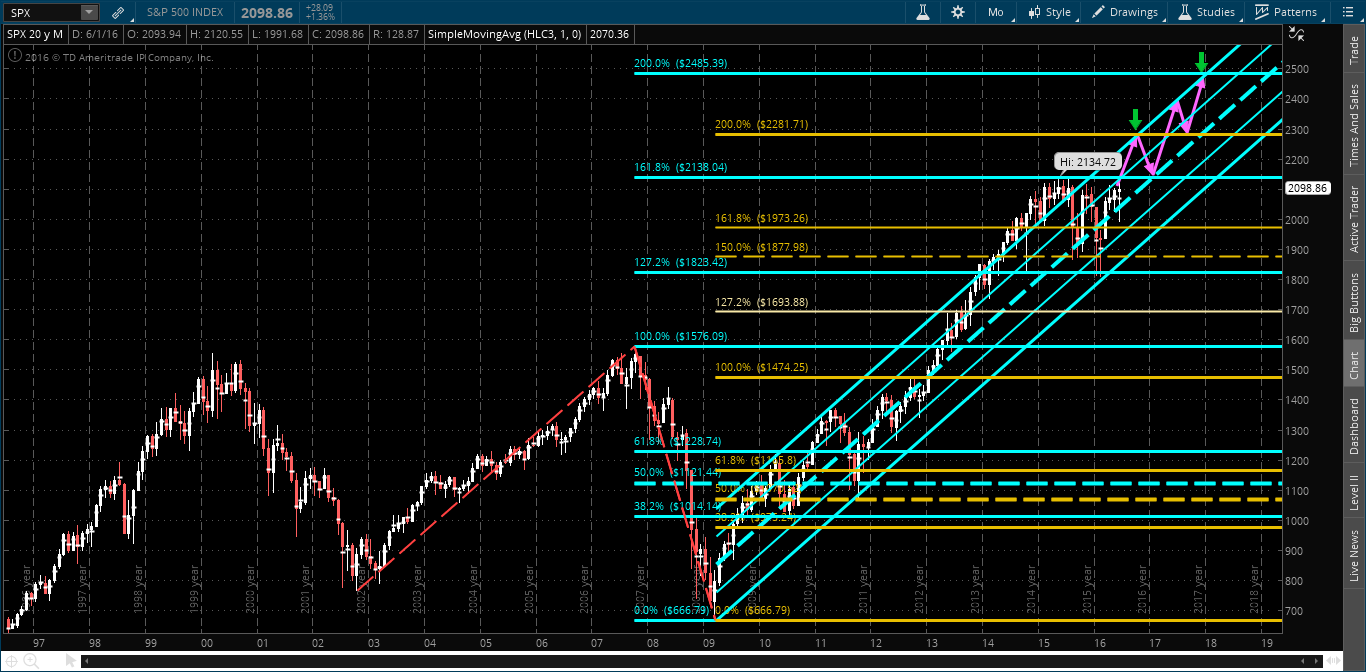
As shown on the following 20-year monthly chart of the SPX, a solid breakout and hold to the upside of this large range could produce a rally to a confluence of the top of a long-term channel and a 200% Fibonacci Extension level of 2280 (yellow) by roughly October of this year, and, eventually, another confluence of the channel top and a 200% External Fibonacci level of 2485 (blue) by approximately December 2017.
That's a very bullish scenario and one that may take quite a bit longer to play out, with, possibly, a lot more volatility sprinkled into the mix than what I've shown...anything can happen between now and then, but the potential is there, nonetheless.
Trading in financial instruments and/or cryptocurrencies involves high risks including the risk of losing some, or all, of your investment amount, and may not be suitable for all investors. Prices of cryptocurrencies are extremely volatile and may be affected by external factors such as financial, regulatory or political events. Trading on margin increases the financial risks.
Before deciding to trade in financial instrument or cryptocurrencies you should be fully informed of the risks and costs associated with trading the financial markets, carefully consider your investment objectives, level of experience, and risk appetite, and seek professional advice where needed.
Fusion Media would like to remind you that the data contained in this website is not necessarily real-time nor accurate. The data and prices on the website are not necessarily provided by any market or exchange, but may be provided by market makers, and so prices may not be accurate and may differ from the actual price at any given market, meaning prices are indicative and not appropriate for trading purposes. Fusion Media and any provider of the data contained in this website will not accept liability for any loss or damage as a result of your trading, or your reliance on the information contained within this website.
It is prohibited to use, store, reproduce, display, modify, transmit or distribute the data contained in this website without the explicit prior written permission of Fusion Media and/or the data provider. All intellectual property rights are reserved by the providers and/or the exchange providing the data contained in this website.
Fusion Media may be compensated by the advertisers that appear on the website, based on your interaction with the advertisements or advertisers.