Fibonacci Price Ladder Prediction: Part 2
Chris Vermeulen | May 16, 2018 12:02AM ET
Recently, we authored an article about Fibonacci price levels in which we referred to a term called “Fibonacci Price Ladders”. This is our own term, as far as we know, and we used it as a way to attempt to explain how price operates within the Fibonacci theory. Our objective was to allow the reader to think of a standard ladder and how each ladder rung allows the climber to advance (move up) or decline (move down) using the ladder. We hope it helped all of our readers to better understand the concept of how price rotates within a trend to establish longer-term price trends.
Within this post, we are going to revisit this Fibonacci Price Ladder concept to show you how recent price rotation may be setting up for a new, and possibly historical, price advance in the near future. We urge our readers to revisit our earlier Fibonacci Price Ladder research to refresh your memory should you have any questions about this research.
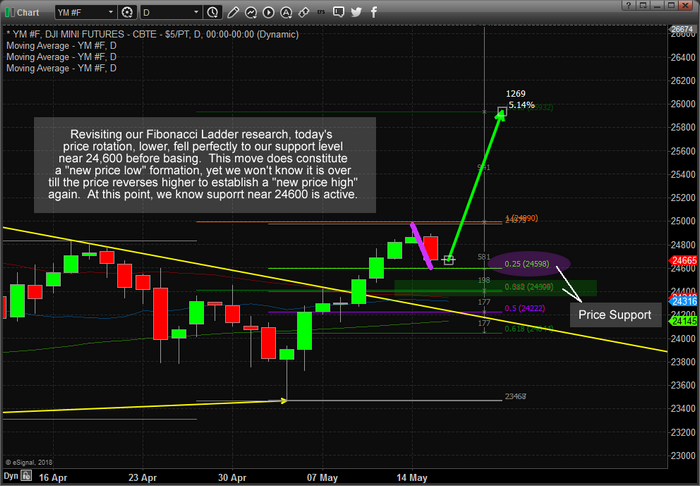
Daily Dow Index Chart
This Daily YM Mini DOW Index chart shows the price rotation, downward, that moved directly to our Fibonacci support level near 24,600. Technically, this constitutes a “new price low” formation and could foretell the end of this price correction before a new price advance begins. If you remember, our prior analysis has indicated a very strong potential for a very strong price move higher from recent lows. Yes, we expected this move and actually protected ourselves and our members by pulling profits in some trades near the highs last week. Now that this move appears to be nearing completion with a proper Fibonacci price rotation, we believe a new price bottom will form quickly near the 24,600 level (with massive support existing above 24,400) driving a new price advance within days.
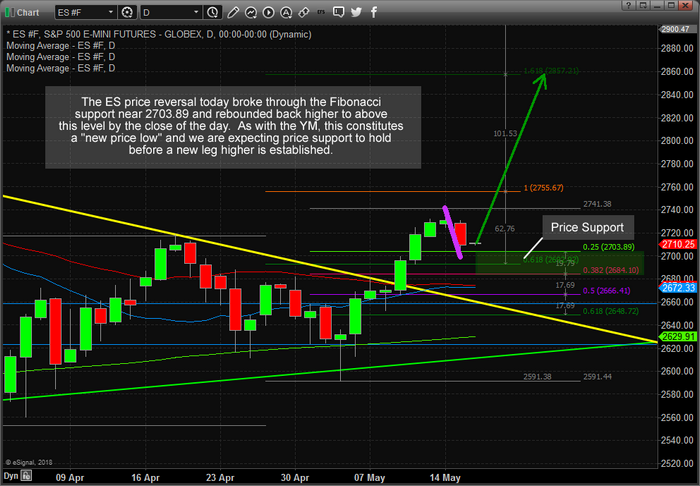
Daily ES Chart
This Daily ES chart helps to confirm the Fibonacci Price Ladder analysis by showing an even deeper “new price low” price rotation recently forming. Massive price support exists in the ES between 2684 and 2700 and we believe this level will hold to form a price bottom/base before a new leg higher will advance price to new highs.
This Fibonacci Ladder process is simple to understand, once a new price high or low is established, any failure to continue to set new immediate higher highs or lower lows constitutes a potential failure of the current price trend. So, if this recent low price move is a move to near a market base/bottom, then we should expect an upside price rotation to set up fairly quickly over the next few days. We believe this will be the case and that traders should already be looking for new entry levels for the next leg higher.
Daily VIX Chart
This last Daily VIX chart showing Fibonacci Time/Price cycles shows that we are nearing a major cycle date, with resistance just above the current price of the vix. We should expect the current downside stock market price to possibly extend downward, briefly, to establish a low price rotation and then reverse higher to begin a new upside price leg.
It is our belief that the VIX will stall near the resistance level and fall back to near or below $11 as the new upside price advance in the US majors extends to near all-time highs.
Currently, we see this price rotation as a healthy normal price rotation that is essential to a further price advance. Price MUST attempt to rotate while establishing new price lows in order to establish new price highs. This is healthy, normal price rotation that we believe will result in a larger price advance in the immediate future.
Trading in financial instruments and/or cryptocurrencies involves high risks including the risk of losing some, or all, of your investment amount, and may not be suitable for all investors. Prices of cryptocurrencies are extremely volatile and may be affected by external factors such as financial, regulatory or political events. Trading on margin increases the financial risks.
Before deciding to trade in financial instrument or cryptocurrencies you should be fully informed of the risks and costs associated with trading the financial markets, carefully consider your investment objectives, level of experience, and risk appetite, and seek professional advice where needed.
Fusion Media would like to remind you that the data contained in this website is not necessarily real-time nor accurate. The data and prices on the website are not necessarily provided by any market or exchange, but may be provided by market makers, and so prices may not be accurate and may differ from the actual price at any given market, meaning prices are indicative and not appropriate for trading purposes. Fusion Media and any provider of the data contained in this website will not accept liability for any loss or damage as a result of your trading, or your reliance on the information contained within this website.
It is prohibited to use, store, reproduce, display, modify, transmit or distribute the data contained in this website without the explicit prior written permission of Fusion Media and/or the data provider. All intellectual property rights are reserved by the providers and/or the exchange providing the data contained in this website.
Fusion Media may be compensated by the advertisers that appear on the website, based on your interaction with the advertisements or advertisers.