Oil Surges Amid Falling U.S. Inventories: Where Will It Lead?
Sunshine Profits | Sep 16, 2021 04:01PM ET
Oil prices rose to their highest level in two months as U.S. inventories fell more than twice what was expected. Where will it lead us?
Trading Position
We took the position in the forecasted $67.53-67.94 key support zone, and some partial profits were saved by our suggested stop-win at $68.82 last week. However, what’s the most important: the main target that we expected previously at $72.30 was finally reached yesterday.
Market Analysis
U.S. crude inventories for the past week fell 6.4 million barrels (Mb), more than double what analysts had expected (2.7). Gasoline reserves have fallen by 1.9 million barrels, against 3.3 million expected. Notably, strategic crude oil reserves have also declined, by 500,000 barrels.
This phenomenon could be explained by the maintenance of a high level of exports despite the impact on production of the passage of Hurricane Ida in the Gulf of Mexico.
Exports have indeed increased compared with the previous week and are now higher than those of the same period last year.
As a consequence of Hurricane Ida, many companies had to suspend the activity of their rigs in the Gulf of Mexico, as well as of several refineries in Louisiana, also hit by the extreme climatic episode.
As a result, gasoline deliveries remain below their level of last year, even taking into account the drop in demand linked to the end of the summer period, with cooler temperatures.
Our view now is that we could see a pullback to previous supports, either $70.61 (which wouldn’t be the best entry from the risk-to-reward point of view) or $69.39 (which would be preferable). This retracement could either happen (Fig.1):
- Straightaway, which would confirm a long-term bearish trend configuration by failing to break higher, above the $73.52 and $74.77 highs (the next resistance levels). Therefore, the market would be topping at a lower high (as defined by the Dow Theory ) [scenario A].
- Once the auctioneers push the prices higher (at least above $73.52) – this scenario would redefine a new long-term bullish trend (with higher highs) [scenario B].
Given the recent market developments, the weekly chart (Fig.2) shows a bullish engulfing candle that could eventually confirm the continuation of a bullish trend.
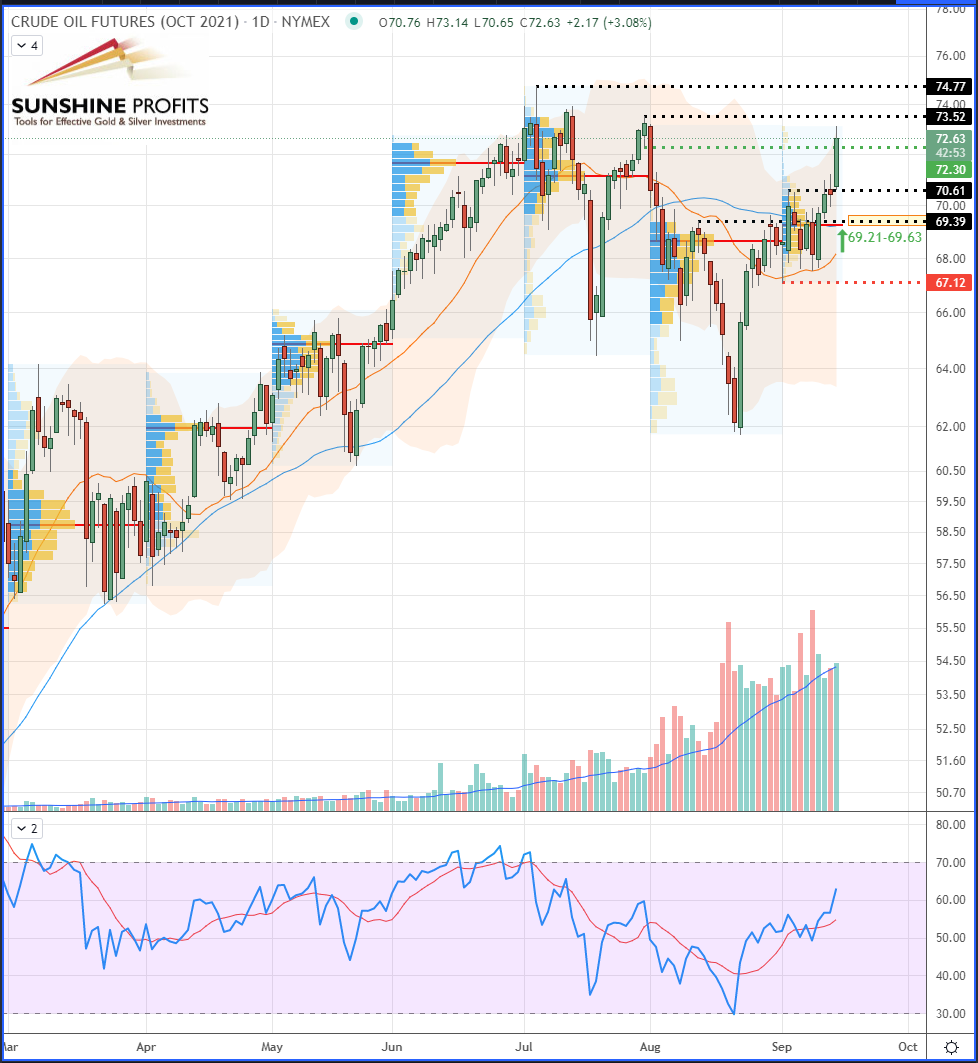
Figure 1 – WTI Crude Oil (CLV21) Futures (October contract, daily)
Figure 2 – WTI Crude Oil (CLV21) Futures (October contract, weekly)
In summary, our trading plan on crude oil relies on various scenarios that we have described. For now, in order to see a clearer market picture, we will wait for confirmation. However, as always, we provide you with a pre-defined position that will (or not) be executed, depending on the next price action and oil supply/demand.
Trading in financial instruments and/or cryptocurrencies involves high risks including the risk of losing some, or all, of your investment amount, and may not be suitable for all investors. Prices of cryptocurrencies are extremely volatile and may be affected by external factors such as financial, regulatory or political events. Trading on margin increases the financial risks.
Before deciding to trade in financial instrument or cryptocurrencies you should be fully informed of the risks and costs associated with trading the financial markets, carefully consider your investment objectives, level of experience, and risk appetite, and seek professional advice where needed.
Fusion Media would like to remind you that the data contained in this website is not necessarily real-time nor accurate. The data and prices on the website are not necessarily provided by any market or exchange, but may be provided by market makers, and so prices may not be accurate and may differ from the actual price at any given market, meaning prices are indicative and not appropriate for trading purposes. Fusion Media and any provider of the data contained in this website will not accept liability for any loss or damage as a result of your trading, or your reliance on the information contained within this website.
It is prohibited to use, store, reproduce, display, modify, transmit or distribute the data contained in this website without the explicit prior written permission of Fusion Media and/or the data provider. All intellectual property rights are reserved by the providers and/or the exchange providing the data contained in this website.
Fusion Media may be compensated by the advertisers that appear on the website, based on your interaction with the advertisements or advertisers.