NZD/JPY Forms A Wedge Pattern
Gregor Horvat | Sep 27, 2022 08:51AM ET
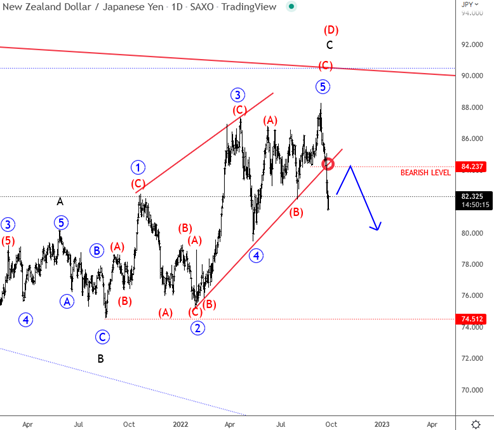
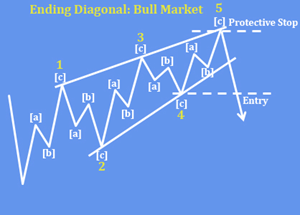
NZD/JPY was trading higher for the last year, but the price action and wave structure overlapped, so it looks like bulls are running out of steam within a wedge shape. In the chart below, the ending diagonal is a reversal pattern labeled with waves 1-2-3-4-5, where each leg is made of three sub-waves (A)-(B)-(C).
From the Elliott wave perspective, we can see a completed final wave (C) of 5 of an ending diagonal within wave C after the recent break below the trendline support and through the bearish level. The move came due to BoJ's intervention and lower stocks due to hawkish Fed policy.
Technically speaking, NZD/JPY can head much lower after a rally, where the 84.23 breakdown point can be new resistance.
An ending diagonal is a special type of pattern that occurs at times when the preceding move has gone too far too fast. A small percentage of ending diagonals appear in the C wave position of A-B- C formations. In all cases, they are found at the termination points of larger patterns, indicating exhaustion of the larger movement.
Trading in financial instruments and/or cryptocurrencies involves high risks including the risk of losing some, or all, of your investment amount, and may not be suitable for all investors. Prices of cryptocurrencies are extremely volatile and may be affected by external factors such as financial, regulatory or political events. Trading on margin increases the financial risks.
Before deciding to trade in financial instrument or cryptocurrencies you should be fully informed of the risks and costs associated with trading the financial markets, carefully consider your investment objectives, level of experience, and risk appetite, and seek professional advice where needed.
Fusion Media would like to remind you that the data contained in this website is not necessarily real-time nor accurate. The data and prices on the website are not necessarily provided by any market or exchange, but may be provided by market makers, and so prices may not be accurate and may differ from the actual price at any given market, meaning prices are indicative and not appropriate for trading purposes. Fusion Media and any provider of the data contained in this website will not accept liability for any loss or damage as a result of your trading, or your reliance on the information contained within this website.
It is prohibited to use, store, reproduce, display, modify, transmit or distribute the data contained in this website without the explicit prior written permission of Fusion Media and/or the data provider. All intellectual property rights are reserved by the providers and/or the exchange providing the data contained in this website.
Fusion Media may be compensated by the advertisers that appear on the website, based on your interaction with the advertisements or advertisers.