NZD/CAD Technicals Show Rangebound Action but Breakout Risks Grow
MarketPulse | Jun 11, 2025 02:01AM ET
Traders are constantly seeking the next opportunity to elevate their results. A common challenge, however, is that many focus on the same popular products and patterns. So, how can one differentiate their approach?
One effective way is to explore less commonly traded currency pairs. While some might be concerned about liquidity issues with certain financial products, the Forex market is globally the most liquid. Even the least traded major forex pairs offer ample liquidity and unique opportunities.
Following our recent analysis of AUD/CAD, we now invite you to discover how trading NZD/CAD can open new horizons, potentially generating alpha – returns that outperform the broader market or average trader.
Differences between the Canadian Dollar and the New Zealand Dollar
Commodities heavily influence both the New Zealand and Canadian dollars, as both nations are significant exporters. The NZD tends to react more to moves in agricultural products, particularly dairy, meat, and wood, given New Zealand's strong reliance on these exports. The CAD remains closely tied to oil and natural gas price fluctuations, reflecting Canada's abundant energy resources.
Beyond commodities, the currencies are driven by their respective economic ties: Canada is closely linked to trends in the U.S., its largest trading partner, with substantial integration in industries like automotive manufacturing. New Zealand is more sensitive to developments in Asia-Pacific economies, especially China and Australia, which are its major trading partners.
In the absence of fresh geopolitical shocks, traders are focusing on central bank policy divergence and incoming economic data.
On that front, the Bank of Canada recently paused its rate-cutting cycle at its meeting on June 4, 2025, holding its policy rate at 2.75%. This followed a series of cuts that began in June 2024. Markets widely expected this hold, as the BoC remains in a wait-and-see mode, particularly given ongoing uncertainty regarding U.S. tariff changes and their potential economic impact.
Meanwhile, the Reserve Bank of New Zealand (RBNZ) commenced its own cutting cycle in April 2025 with a 25 basis point cut, bringing the Official Cash Rate (OCR) to 3.50%, and followed up with another 25 basis point cut in May 2025, bringing the OCR to 3.25%. The RBNZ has signaled that more cuts may follow, citing a lower inflation outlook and global trade risks.
NZDCAD Technical Analysis
Taking a Step Back - Monthly Timeframe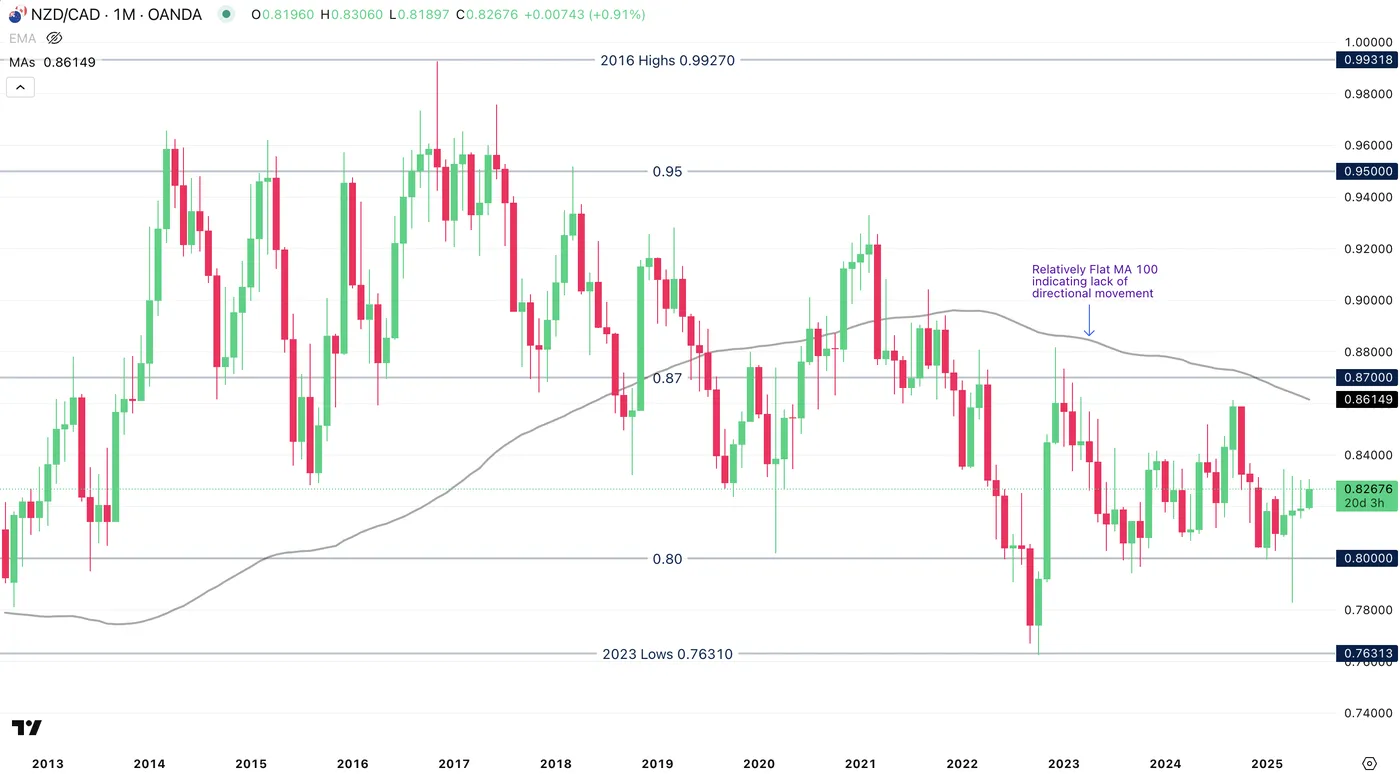
Source: TradingView
The main thing to notice in this monthly chart is how the currency pair hasn't been subject to any particular breakouts. Similarly to AUD/CAD, the currencies have been moving depending on their own central bank policies and global demand for commodities, although as both nations are commodity exporters, they tend to move in relative tandem.
The Monthly charts establish a 15c range between 0.95 and 0.80 on the pair for the past 12 years, with lower extremes at 0.76 in 2022 as Canada expedited its hike cycle, though prices reverted quickly to their mean.
The Pair also came close to parity in 2016, attaining highs of 0.9927 in November as markets priced in the first Trump Election, though the extension also reversed swiftly, forming a major wick on the Monthly candle.
Longer moving averages, such as the MA 100 on the Monthly, are mostly flat, indicating a lack of directional trend. Prices have although been going towards the lower part of the range since 2021 and have started to rebound since.
Taking a Closer Look - Daily Chart
Source: TradingView
Prices have been resiliently staying within a 0.80 to 0.84 range since July 2023, with a few exceptions indicated on the charts.
The resilience of the range is shown from the same swift return to the mean as prices try to break out unsuccessfully.
Prices seem to take a progressive turn to the upside with the Daily MA 100 acting as support, this happens after multiple higher timeframe rebounds on the lower end of the aforementioned Yearly range.
Let's take an even closer look to see what the current trend is in the pair.
Zooming in to the 4H Chart
Since the extreme lows attained during the peak of Liberation Day tariff fears, prices have rebounded strongly and have been consolidating since the latter part of April in a clean range.
Prices have rebounded multiple times between the 0.8170 Support and the 0.83 Resistance - particularly as the 4H RSI attains overbought and oversold extremes.
The MA 100 once again confirms a more rangebound momentum and doesn't indicate any particular change of trend.
However, in trading, you always have to be prepared for a change of the current establishment
In that aspect:
- A breakout to the upside points to the monthly major pivot at 0.8380
- A breakdown points towards the mid-April swing low at 0.81
Safe Trades!
Trading in financial instruments and/or cryptocurrencies involves high risks including the risk of losing some, or all, of your investment amount, and may not be suitable for all investors. Prices of cryptocurrencies are extremely volatile and may be affected by external factors such as financial, regulatory or political events. Trading on margin increases the financial risks.
Before deciding to trade in financial instrument or cryptocurrencies you should be fully informed of the risks and costs associated with trading the financial markets, carefully consider your investment objectives, level of experience, and risk appetite, and seek professional advice where needed.
Fusion Media would like to remind you that the data contained in this website is not necessarily real-time nor accurate. The data and prices on the website are not necessarily provided by any market or exchange, but may be provided by market makers, and so prices may not be accurate and may differ from the actual price at any given market, meaning prices are indicative and not appropriate for trading purposes. Fusion Media and any provider of the data contained in this website will not accept liability for any loss or damage as a result of your trading, or your reliance on the information contained within this website.
It is prohibited to use, store, reproduce, display, modify, transmit or distribute the data contained in this website without the explicit prior written permission of Fusion Media and/or the data provider. All intellectual property rights are reserved by the providers and/or the exchange providing the data contained in this website.
Fusion Media may be compensated by the advertisers that appear on the website, based on your interaction with the advertisements or advertisers.