No New High in 67 Days: Are Stocks Stuck in a Narrative Loop?
Callum Thomas | May 26, 2025 01:09AM ET
This week: technical check, narratives, new highs, shorts, valuations, healthcare, profitability, missing days, reshoring, tech vs commodity capex.
Learnings and conclusions from this week’s charts:
-
The S&P 500 sold off from resistance (and overbought conditions).
-
It’s now been 67 days since the last new all-time high.
-
Stocks are expensive, bonds are cheap.
-
Surging short interest shows increased interest in shorting.
-
Reshoring talk is rising, tech capex is dominating (got commodities?).
Overall, it seems like the sell-off that everyone was waiting for has finally arrived. Technically speaking the market was ripe and primed for a pullback, and simply awaiting some news or narratives as a reason/excuse. With the ebb and flow of policy pronouncements and macro narratives, as I outline this week; it brings to mind a new acronym “RTFL” (Range Trading For Longer).
1. Resistance: Just as new highs seemed within reach, and just as that big round 6000 number was in sight, and just as 50-day moving average breadth reached overbought levels, we got a pullback. Plenty of support in close proximity, e.g., 5800, the 200-day average, and even stronger support close by at 5600. But one awkward thing for bulls is that this kind of looks like a lower high.
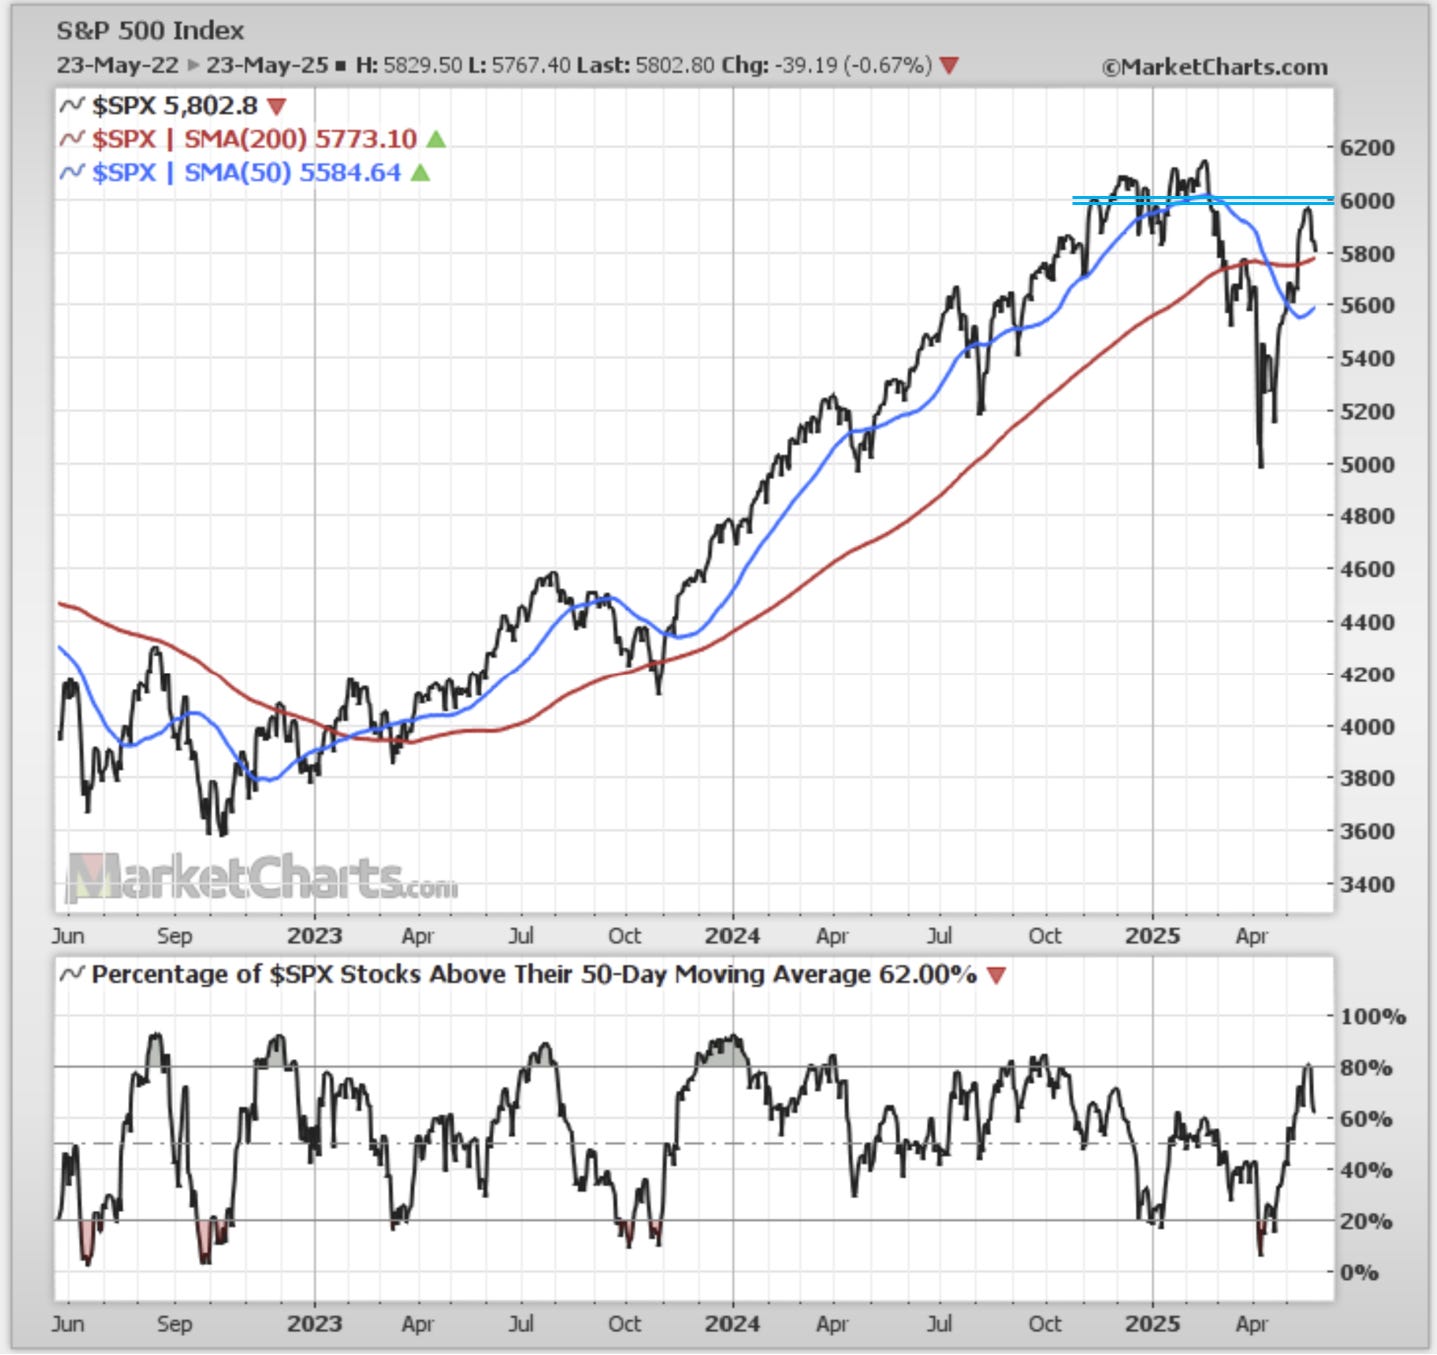
Source: Callum Thomas using MarketCharts charting tools
2. VIX Base: On a similar note the VIX is ticking up off the lows and VIX sentiment is turning up after resetting back to complacent levels.
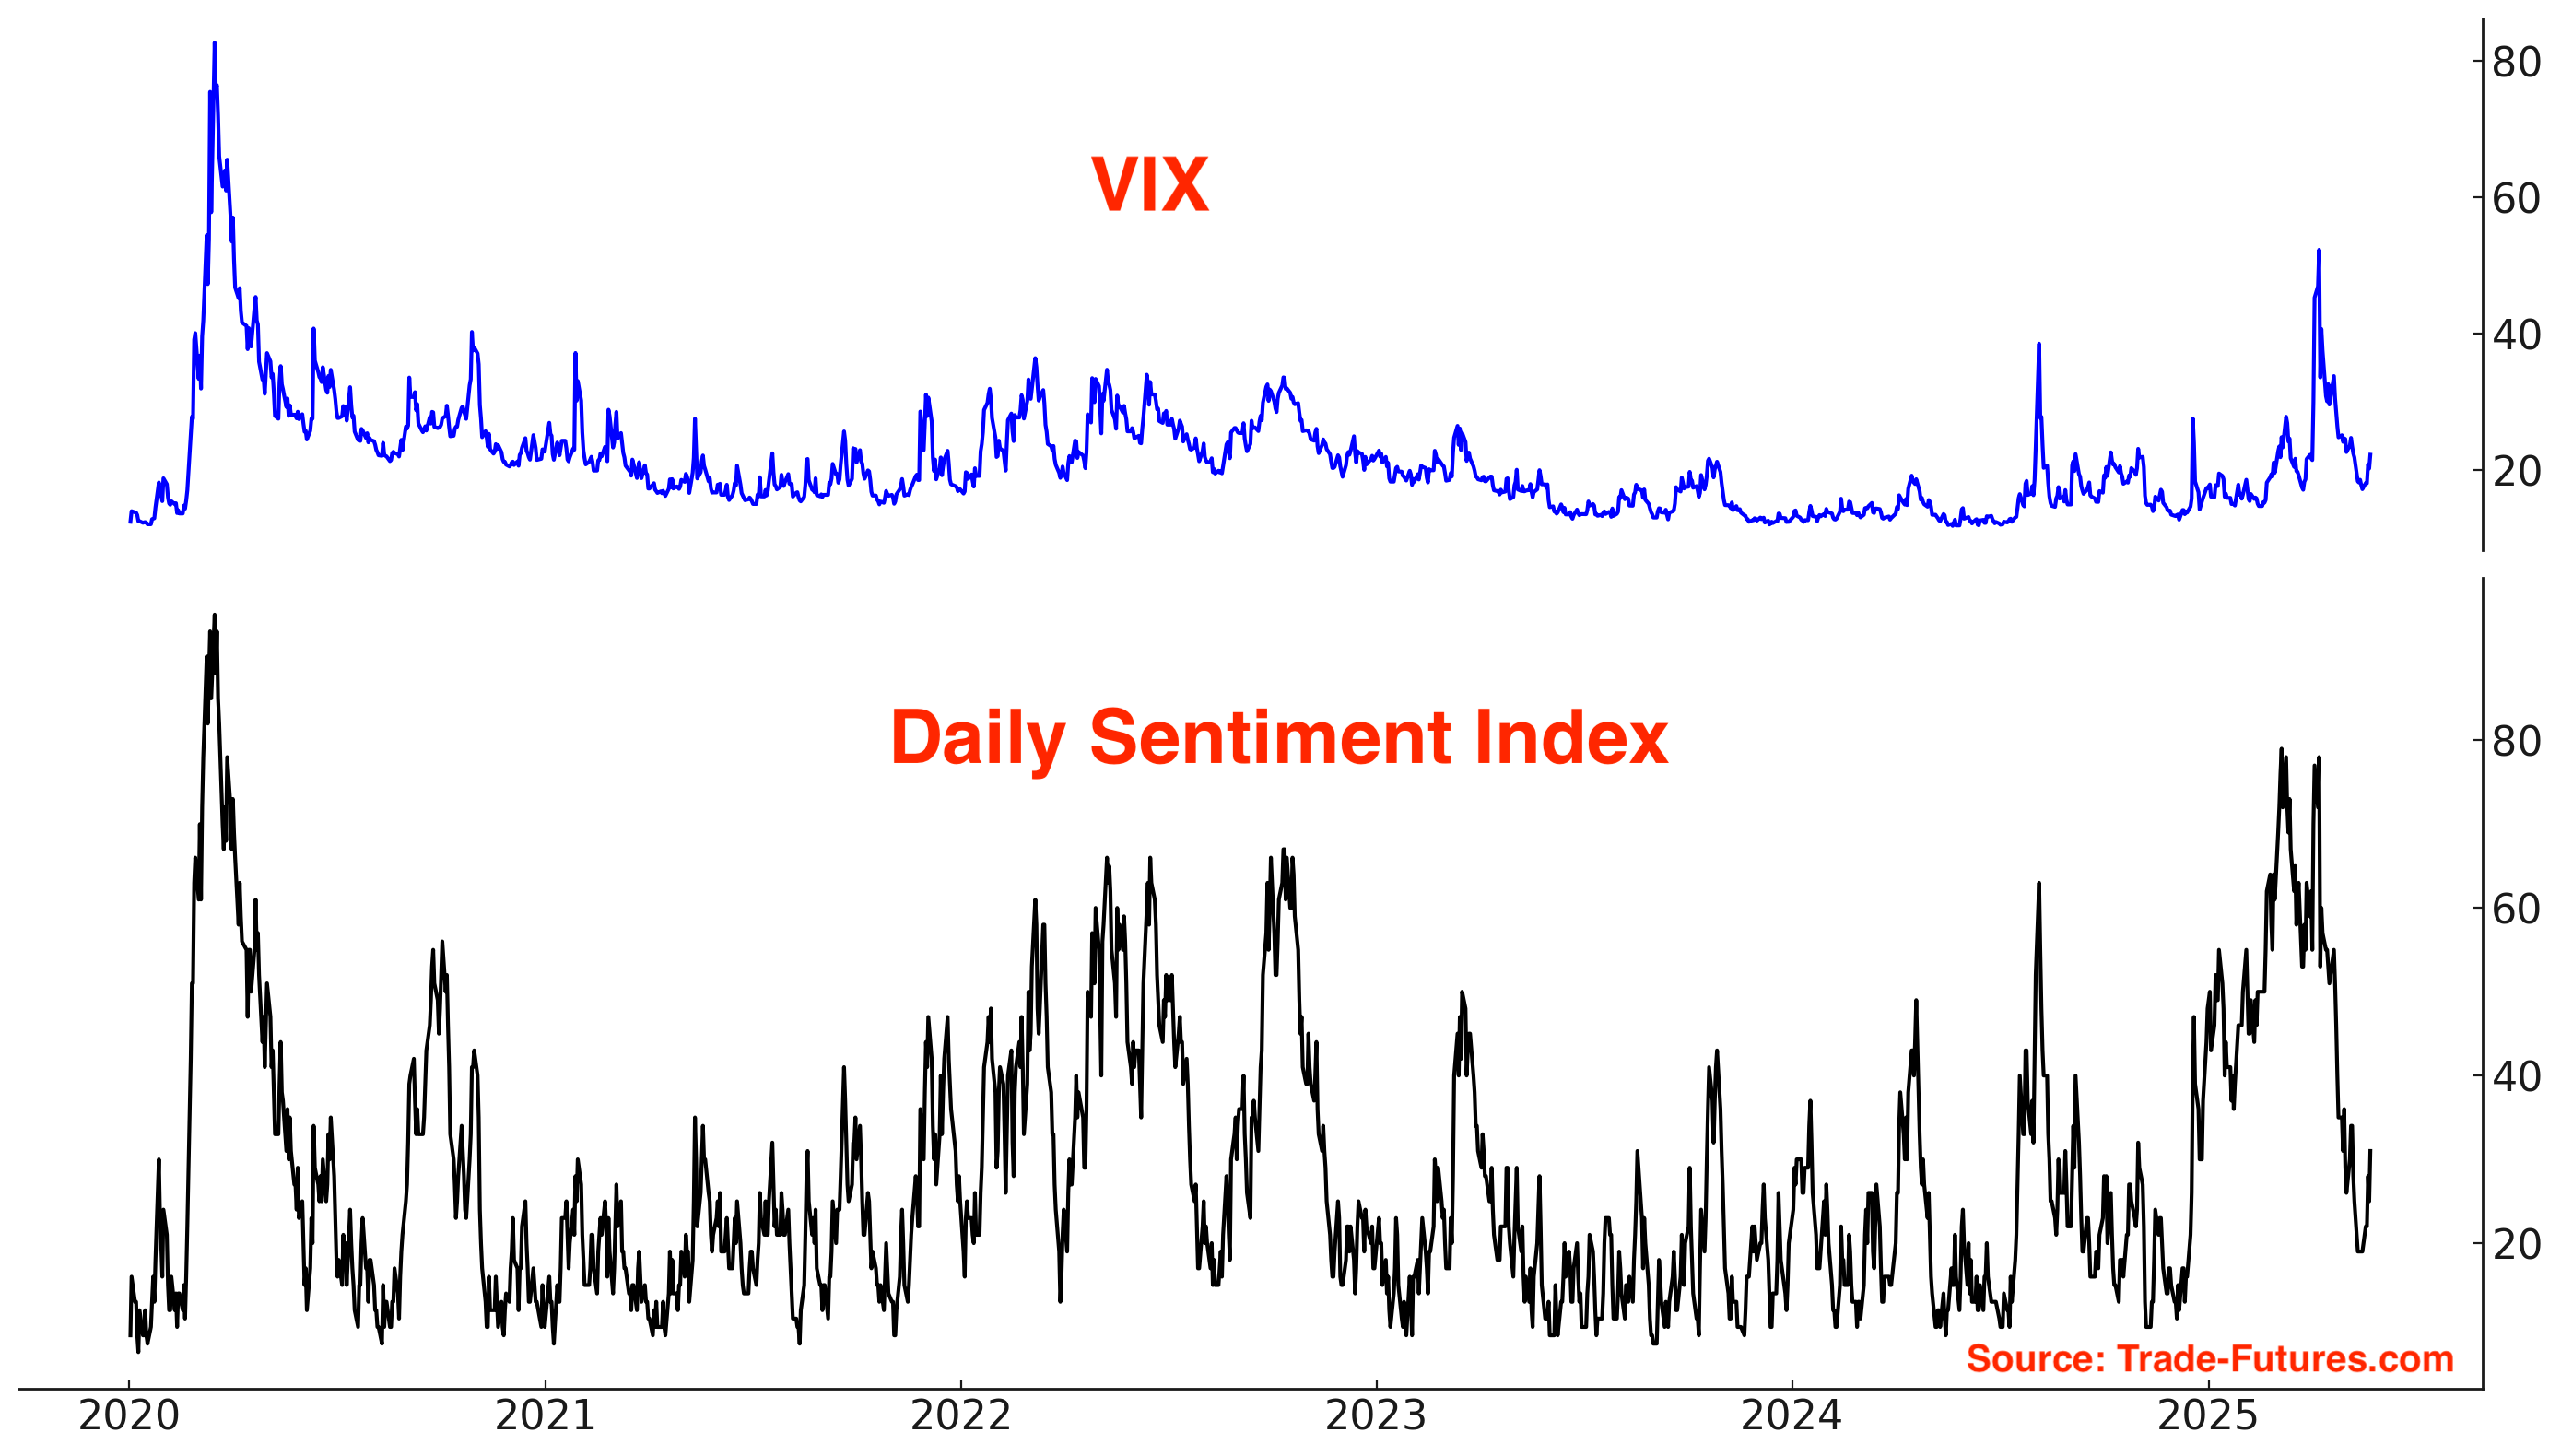
Source: SubuTrade
3. Narrative Rotation: The “reason” or excuse for the sell-off is arguably a mix of higher bond yields as we continue to rotate between macro-narratives of recession fears vs resurgent growth/inflation and the headwind of higher yields. And then there’s the usual Trump/tariff threats, which are likewise going through their own process of ebbing and flowing. Range trade for longer?
Source: @MichaelKantro
4. Waiting for New Highs: Back on the topic of waiting for new all-time highs, it’s now been 67 trading days since the last new all-time high. And if we go back to those narratives from earlier in the year with Bessent and the “period of detox”, maybe the tariff and reform game is a situation of ease-up when the market’s down, and a crack-down when the market’s up.
Even if that’s not the plan, that’s kind of what it looks like so far, and that would be a strong case for range-trading-for-longer (RTFL?).0
Source: Topdown Charts
5. Valuations: While stocks may not have made a new all-time high, valuations are still at the upper end of the range. Bonds, on the other hand, are an entirely different story; cheap on my indicators. And the interesting thing is bonds are about as hated as it gets at the moment; just about every headline and tweet is bashing bonds. Sentiment signal?
Source: Chart of the Week - Stocks vs Bonds
6. Big Short: This one is fascinating as it goes to show you can have a market and set of conditions that go to an extreme and persist there for some time, only to rapidly revert. Shorting is back. Whether this is directional calls on the stock market as a whole or expressing winner vs loser calls in the age of tariffs and policy shocks (e.g. healthcare) is certainly a matter of intrigue and probably a bit of both.
Original Post
Trading in financial instruments and/or cryptocurrencies involves high risks including the risk of losing some, or all, of your investment amount, and may not be suitable for all investors. Prices of cryptocurrencies are extremely volatile and may be affected by external factors such as financial, regulatory or political events. Trading on margin increases the financial risks.
Before deciding to trade in financial instrument or cryptocurrencies you should be fully informed of the risks and costs associated with trading the financial markets, carefully consider your investment objectives, level of experience, and risk appetite, and seek professional advice where needed.
Fusion Media would like to remind you that the data contained in this website is not necessarily real-time nor accurate. The data and prices on the website are not necessarily provided by any market or exchange, but may be provided by market makers, and so prices may not be accurate and may differ from the actual price at any given market, meaning prices are indicative and not appropriate for trading purposes. Fusion Media and any provider of the data contained in this website will not accept liability for any loss or damage as a result of your trading, or your reliance on the information contained within this website.
It is prohibited to use, store, reproduce, display, modify, transmit or distribute the data contained in this website without the explicit prior written permission of Fusion Media and/or the data provider. All intellectual property rights are reserved by the providers and/or the exchange providing the data contained in this website.
Fusion Media may be compensated by the advertisers that appear on the website, based on your interaction with the advertisements or advertisers.