S&P 500: New Top Forming?
Andre Gratian | Aug 08, 2016 02:29AM ET
Current Position of the Market
SPX Long-term trend: The long-term trend is up but weakening. Potential final phase of bull market.
SPX Intermediate trend: The uptrend from 1810 continues.
Analysis of the short-term trendis done on a daily basis with the help of hourly charts. It is animportant adjunct to the analysis of daily and weekly charts which discuss longer market trends.
New Top Forming?
Market Overview
After nearly three weeks of trading in a narrow range, SPX faked an upside break-out and immediately reversed to complete its minor correction at 2148 before starting a new uptrend. It reached 2182 after Friday’s better than expected jobs report, but ran into trend line resistance and spent most of the day in a two-point range. This action, as well as the structure suggests that it is now completing a move from 1992 and will need to correct -- perhaps substantially – before going higher. By substantial, I mean .382 or .50 of the uptrend. But before it does, it could still have a few more points on the upside and may need to create a small distribution phase. If this analysis is correct, we should be able to achieve a reversal by the end of next week at the latest.
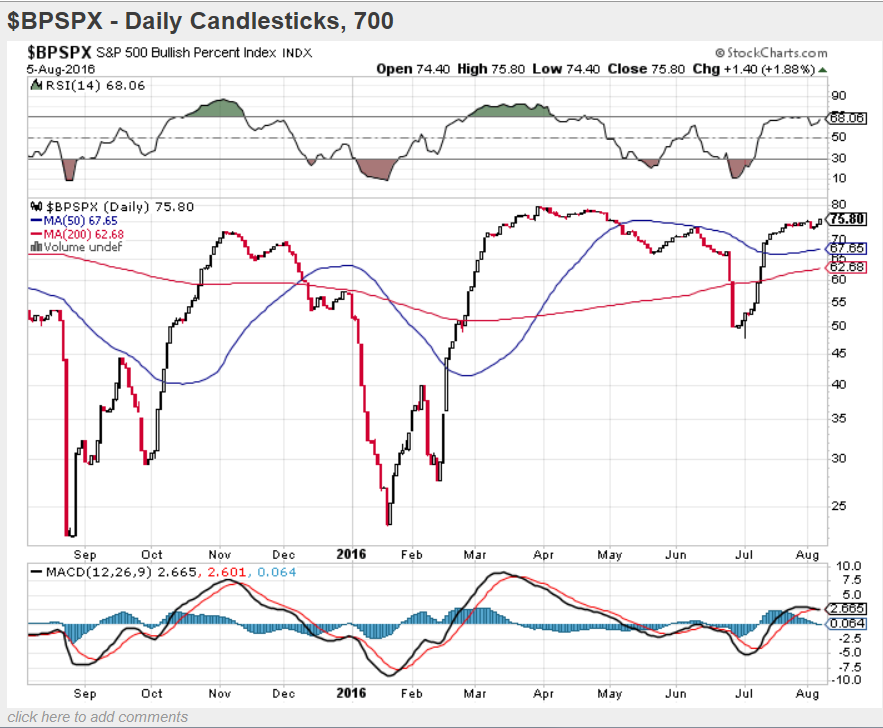
The BPSPX (chart courtesy of StockChart.com,as well as the one below) continues to mimic the recent pattern of SPX, all the time remaining below its April high, which results in negative divergence with SPX. In addition, the BPSPX RSI indicator is beginning to sow some divergence at the same time that it is slightly overbought.
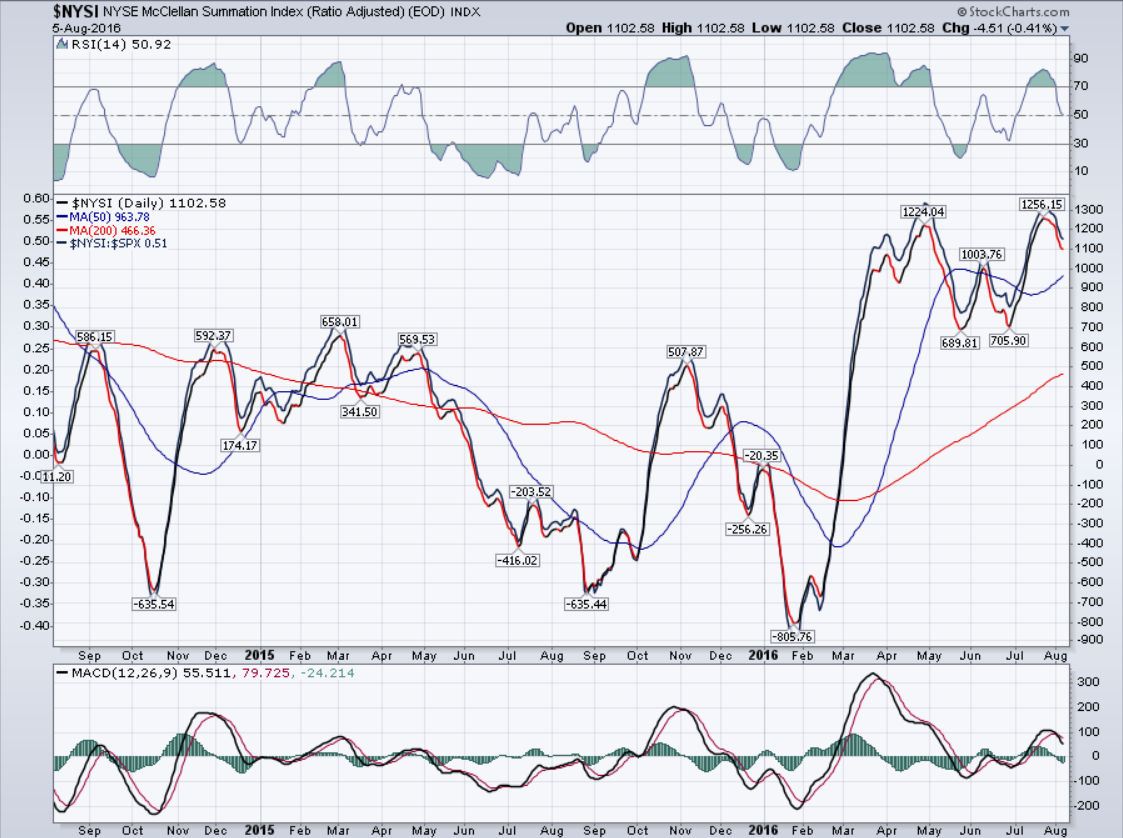
I am also posting the McClellan Summation Index below. Breadth, in the form of the A/D line has been has been given a great deal of publicity lately because its strong relative strength to the market. It may be misleading us! The NYSI gives us a different kind of picture. Not only was its recent high already showing negative divergence when compared to SPX, but where does it show the new high that SPX made last week? Nowhere! It only increased its negative divergence. For this reason and others that I will discuss later, I believe that we are about to make another, more substantial top, than the one forecasted three weeks ago.
SPX Chart Analysis(This chart and others below, are courtesy of QCharts.com.)
Daily chart
Last week, SPX performed pretty much as expected. I had suggested that if there were no follow through to the upside, we could get a quick drop to the 2155 support before turning around and making a new high. Instead, the index found support a little lower, at 2148 before starting a new uptrend.
As we will see more clearly on the hourly chart, the new uptrend was sluggish from the start. This led me to believe that the correction might not be over and that we could decline to the next support/projection of 2136. There must have been some foreknowledge that the jobs report was going to exceed expectations, because instead of going lower, SPX continued to grind higher into Thursday with a little pull-back into the close. This was followed by an explosion to the upside when the market opened,but investor apathy returned after the first couple hours.
This is not market action which suggests that we are starting an important move. As the index made a new all-time high, the lower oscillators only made it to the zero line and the MACD still has not even made a bullish cross in its two MAs. Had SPX continued its momentum into the last hour, I would be more inclined to forecast this as an important break-out. But it appears to me that this is only a wave 5 of the move starting at 1992which will be limited in price appreciation and followed by a correction of that entire uptrend.
The index could redeem itself with a strong opening on Monday which would give it the needed follow through. If it does not, we may well be ready to start a larger corrective wave early in the week.
Hourly Chart
If the structural analysis is correct, wave 3 from 1992 ended with a sluggish, three-week move to 2178 before a brief wave 4 ended at 2148. That would make wave 5 from 1948 mostly complete (unless it is only wave 1 of 5!).
Expanding this count back to 1810,this would then be the possible end of wave 3 from that level, which would then be followed by wave 4 (currently expected shortly) and a final wave 5 to our mid 2200s projection to complete primary wave V of the bull market which started in 2009! After that, could we please have a bear market?
Back to the hourly chart below! There was a quick 5-wave down from 2178 to complete wave 4 from 1992, a very sluggish wave 1&2 preceding the jobs report, and a wave 3 which may or may not be complete. In any case, not muchis left in this move. It’s possible that the blue parallel lines (which have done such a good job of providing suport and resistance for the past month) will give us the high of wave 5 from 2148. The top dashed line would allow the index to conclude its move at about 2189 which is also a short-term P&F projection.
It would be remarkable if this suggested scenario turned out exactly as proposed. For now at least, it gives us some guidelines to follow.
Some leading & confirming indexes (Weekly)
PowerShares QQQ Trust Series 1 (NASDAQ:QQQ) has joined the ranks of the leaders by making a new high, but it is still shy of its 2000 top by a few points. If the scenario I outlined is correct, it will still have time to surpass it after a correction. The two weaklings remain Dow Jones Transportation and ARCA Securities Broker. NYSE Composite and iShares Russell 2000 (NYSE:IWM) will also have a chance to make a new all-time high, providing that their correction is not too severe. Not a chance for the two laggards! The Dow Jones Industrials making a new high is futile if TRAN does not make one along with it. Dow theorists have surely started to call for an end to this bull market.
PowerShares DB US Dollar Bullish (NYSE:UUP) (dollar ETF)
UUP held where it should have, right on the lower channel line, and then started to move up. On Friday, it received a big boost from the jobs report. It may be ready to challenge the previous resistance level and expand its move to the top channel line, but don’t expect it to do it in a few days. It’s not a fast mover!
GDX (Gold Miners ETF (NYSE:GDX))
Stocks and ETFs which are the traders’ favorites often conform precisely to technical analysis. GDX is one of them. When there is has fairly clear P&F count, it is best to pay close attention to it – as you can see on the daily chart. Trend lines (properly drawn) and support levels are also respected, as well as indicators. The negative divergence which was glaring in both oscillators also confirmed the P&F count.We’ll have to wait for the top to expand with additional distribution to determine the extent of the correction. So far, this is only the first segment.
The wave count may not be as simple as it appears, so I’ll leave it to the experts.
USO (NYSE:USO) (US Oil Trust)
USO should be on its way to 8.50-9.00, but probably not without a consolidation first. The next time it comes down to make a low, it should bottom above the lower channel line with divergence showing in the oscillators.
Summary
SPX may be completing wave 5 from 1992 and getting ready to have a .382/.50 retracement of that uptrend.
Trading in financial instruments and/or cryptocurrencies involves high risks including the risk of losing some, or all, of your investment amount, and may not be suitable for all investors. Prices of cryptocurrencies are extremely volatile and may be affected by external factors such as financial, regulatory or political events. Trading on margin increases the financial risks.
Before deciding to trade in financial instrument or cryptocurrencies you should be fully informed of the risks and costs associated with trading the financial markets, carefully consider your investment objectives, level of experience, and risk appetite, and seek professional advice where needed.
Fusion Media would like to remind you that the data contained in this website is not necessarily real-time nor accurate. The data and prices on the website are not necessarily provided by any market or exchange, but may be provided by market makers, and so prices may not be accurate and may differ from the actual price at any given market, meaning prices are indicative and not appropriate for trading purposes. Fusion Media and any provider of the data contained in this website will not accept liability for any loss or damage as a result of your trading, or your reliance on the information contained within this website.
It is prohibited to use, store, reproduce, display, modify, transmit or distribute the data contained in this website without the explicit prior written permission of Fusion Media and/or the data provider. All intellectual property rights are reserved by the providers and/or the exchange providing the data contained in this website.
Fusion Media may be compensated by the advertisers that appear on the website, based on your interaction with the advertisements or advertisers.