NDX Update: Has The Next Bull To New All-Time Highs Started?
Dr. Arnout ter Schure | Nov 05, 2020 02:20AM ET
Last week, I concluded in my latest article about the NASDAQ 100 (NDX):
“In a normal flat, wave-c = wave-a (red dotted arrow), which could target as low as 10400. Flat corrections can also have truncated c-waves or even extended c-waves. It is, at this stage, impossible to know which it will be, so I must, logically, go by the regular flat until proven otherwise. In that case the index will reach my ideal (red) wave-4 target zone. Besides, 4th waves normally retrace between 23.60 to 38.20% of the prior 3rd wave (purple box) and the latter sits at 10507. Thus, as already said two weeks ago, we should expect the NDX to reach 10500+/-100. But, in the case of a truncated flat, expect the NDX to ideally stall around 10950+/-20, which is the lower end of symmetry breakdown based on the two black boxes. In the case of an expanded flat, expect the NDX to reach as low as 10150+/-50.”
With yesterday’s price action I now know what it most likely was: a truncated flat that stalled at 10957. Right where it should, based on simple symmetry. Thus, while all I could initially do was anticipate a normal flat to 10500 +/- 100, I knew—thanks to the Elliott Wave Principle (EWP)—the market did not have to be normal. I therefore have no fear of missing out on today’s big up day and can instead focus on a good long entry over the next few trading sessions.
The annotations in the daily chart show why Monday’s low makes for a fully acceptable (red) wave-c of wave-4. Thus wave-5 (dotted green arrow) is now most likely underway to new all-time-highs. This 5th wave will subdivide into five smaller waves: i, ii, iii, iv, v. Once wave-i has topped, I can then make calculations on how high the index will ideally go. But I am quite sure we will get extensions of the waves beyond their text-book length as that has been the market’s MO since the Bull in 2009 started.
Figure 1. NDX100 daily candlestick chart with EWP count.
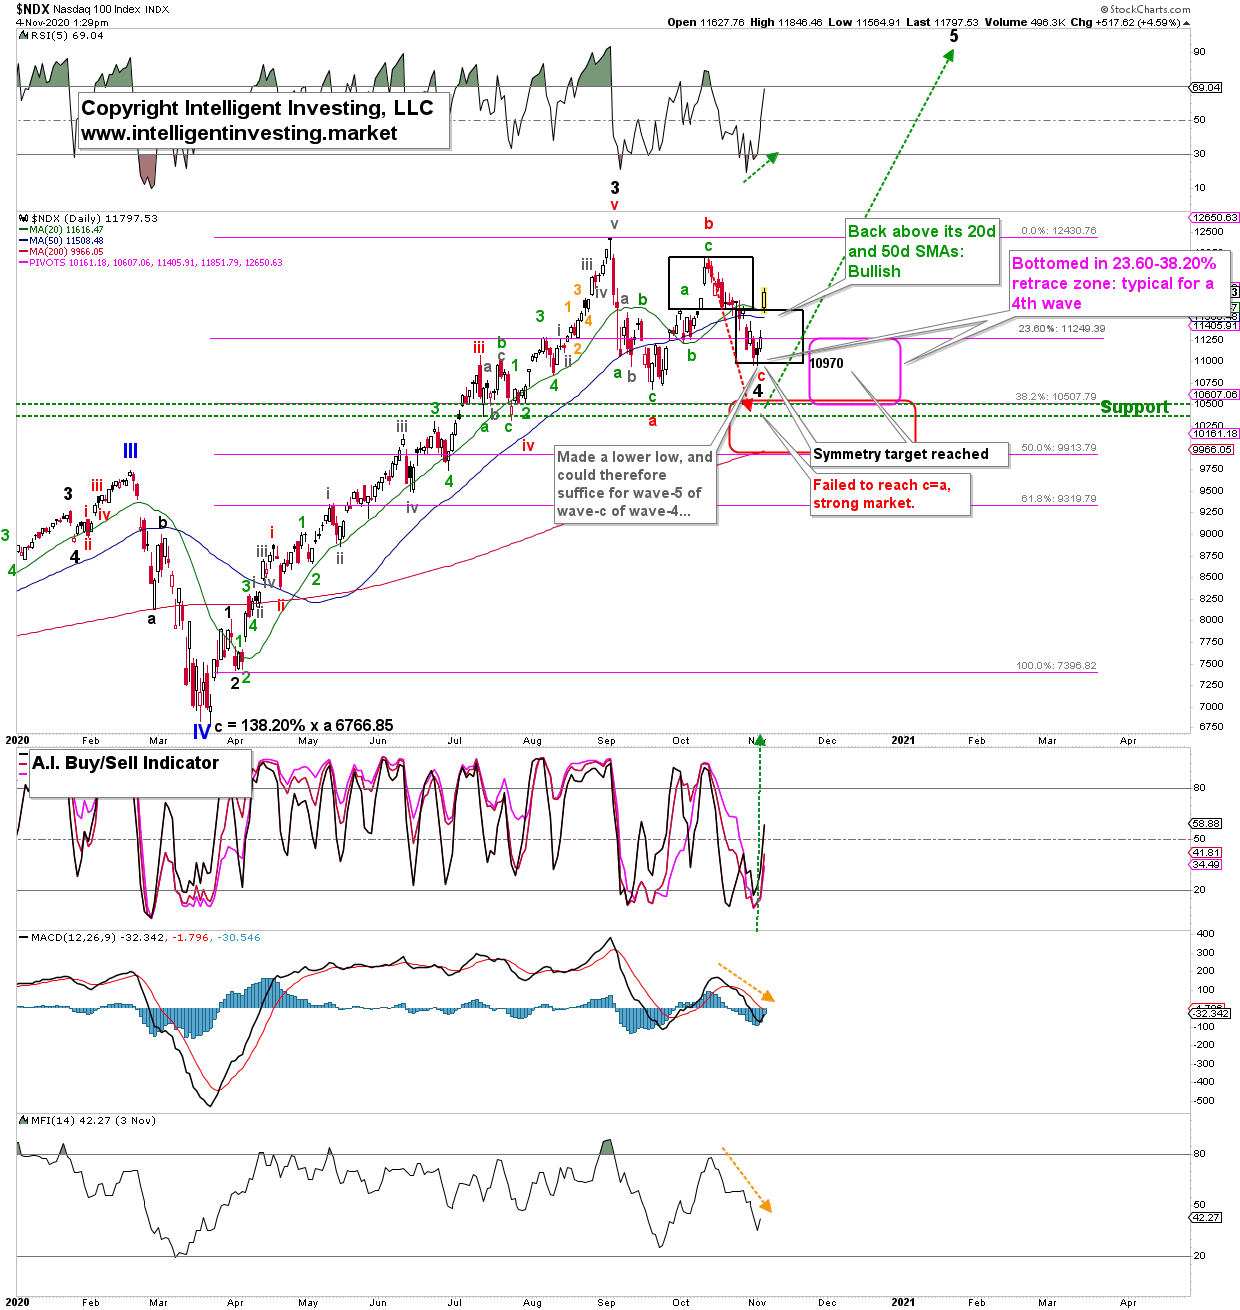
Bottom line: The NDX failed to reach the regular flat price target of 10500+/100 and instead stalled at 10957; the “truncated flat” target of 10950+/-20. It has most likely completedits larger wave-4. Today’s strong jump in price launches it back above its 20d and 50d SMAs, as well as above the downtrend line (not shown in Figure 1) that has held all upside in check since the October 12 high.
Thus, although my preference from last week should have been the reverse,
”Based on the EWP rules and price patterns, the current breakdown is, therefore, most likely a c-wave of a flat 4th wave down to, ideally, NDX 10500+/-100. The index has the option to stall at around 10970, but for now that is not preferred. Once these price levels are reached in the coming days, it is time to prepare for the next larger multi-month 5th wave rally to new All-time Highs.”
thanks to the EWP I know what we are dealing with, and the anticipated next larger multi-month rally has most likely started. I always state “most likely” as clearly there are no certainties in the markets, but the EWP can greatly help me make accurate and reliable forecasts and what outcomes to expect next. My premium members are using those insights to their advantage, as last week I advised for several days
“Please focus on the bigger picture: expect wave-c of wave-4 to ideally bottom around SPX3100+/-100 [it bottomed last week at SPX3234...]after which we’ll IMHO see a multi-month wave-5 rally to SPX4000-4200. If anything, this correction is IMHO still a buying opportunity.”
Trade Safe!
Trading in financial instruments and/or cryptocurrencies involves high risks including the risk of losing some, or all, of your investment amount, and may not be suitable for all investors. Prices of cryptocurrencies are extremely volatile and may be affected by external factors such as financial, regulatory or political events. Trading on margin increases the financial risks.
Before deciding to trade in financial instrument or cryptocurrencies you should be fully informed of the risks and costs associated with trading the financial markets, carefully consider your investment objectives, level of experience, and risk appetite, and seek professional advice where needed.
Fusion Media would like to remind you that the data contained in this website is not necessarily real-time nor accurate. The data and prices on the website are not necessarily provided by any market or exchange, but may be provided by market makers, and so prices may not be accurate and may differ from the actual price at any given market, meaning prices are indicative and not appropriate for trading purposes. Fusion Media and any provider of the data contained in this website will not accept liability for any loss or damage as a result of your trading, or your reliance on the information contained within this website.
It is prohibited to use, store, reproduce, display, modify, transmit or distribute the data contained in this website without the explicit prior written permission of Fusion Media and/or the data provider. All intellectual property rights are reserved by the providers and/or the exchange providing the data contained in this website.
Fusion Media may be compensated by the advertisers that appear on the website, based on your interaction with the advertisements or advertisers.