Navigating The Tidal Wave Of Liquidity
Monica Kingsley | Apr 08, 2021 11:59AM ET
The S&P 500 moved marginally higher in spite of its short-term very extended position, powered by liquidity. Credit markets were hinting at deterioration, the rare constellation I discussed two days ago – Treasury yield moves are exerting no real pressure either on value stocks or technology, including heavyweights, which are picking up the tech upswing slack. Microrotations still pointing higher are the name of the game, on the wave of infrastructure bill expectations as well.
Still, the risk-reward ratio for the bulls is at unsavory levels in the very short run even as the longer time frame perspectives remain really bright. Consider these points I made yesterday :
(…) we have seen quite a record number (around 95%) of stocks trading above their 200-day , which is similar to the setup right after the post-dotcom bubble bear market 2002/3 lows, or 1-2 years after the bull market run off the Mar 2009 lows. Hard to say which one is more hated, but I see the run from March 2020 generational low as the gold medal winner, especially given the denial accompanying it since.
Gold kept its run above $1,740 intact and regardless of the daily weakness in the miners – should that one be repeated more consistently, it would become worrying for the bulls. Looking though again at the USD/JPY chart, I'm increasingly optimistic that the currents working against the king of metals, have turned. That's because whenever the yen, the currency perceived by the market place as a safe haven , strengthens, gold tends to follow its cue. And that's where we are now. The precious metals run to the key $1,760s or even better above $1,775 is approaching, and has already sent my open gold position solidly into the black.
The soft patch I cautioned against at the onset of yesterday's session, has materialized in the miners, and might be very well over by today's closing bell. Yes, I look for mining stocks to reverse yesterday's weakness even in the competition for money flows with the S&P 500 holding up gained ground.
Let's move right into the charts (all courtesy of www.stockcharts.com ).
Inflation Expectations
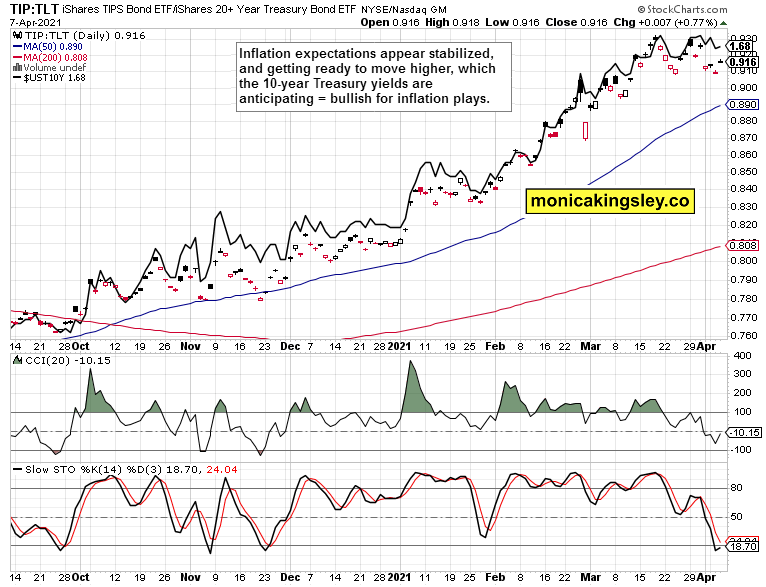
The Treasury inflation protected securities to long-dated Treasuries (TIP:TLT) ratio appears ready to move upwards, and the rising yields are clearly doubting its recent dip.
Gold In Spotlight
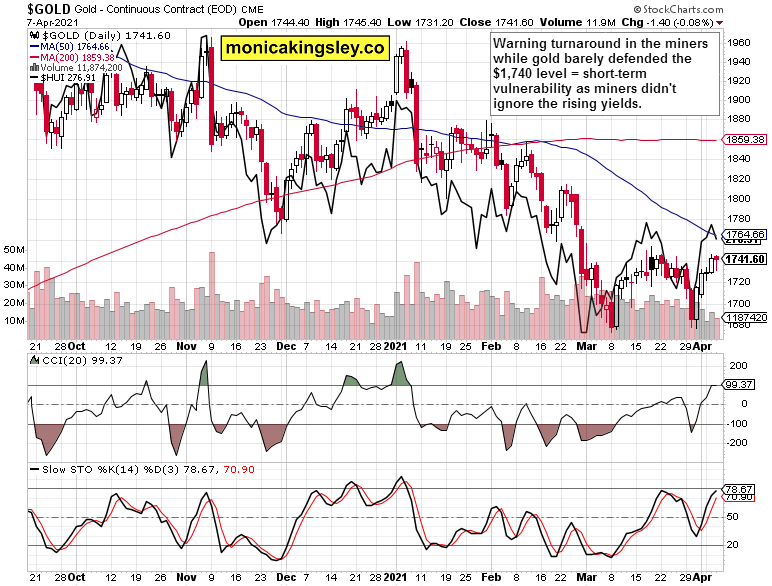
Gold miners compared to gold, don't paint a daily picture of strength. Jumping to conclusions on account of the hanging man formation in gold, would be premature though.
Zooming out, the weekly gold chart with overlaid copper to 10-year Treasury yield, paints a picture of (bullish) turnaround and decoupling. Gold has been clearly attempting to move higher lately, and that will reflect upon the precious metals complex positively as it undergoes its own rotations lifting gold, silver or miners at different stages and magnitudes.
Summary
Miners moving higher again is the first step to power gold upwards sustainably again, but the shifting currency winds would help here as the strengthening yen would facilitate beating the next major set of resistances above $1,760s.
The S&P 500 is likely to keep consolidating gained ground, and (shallow) bear raids wouldn't be unexpected here – in spite of the strong market breadth. We're witnessing VIX trading well below 20 for four sessions in a row while the put/call ratio has risen to the approximate midpoint of its usual range – the bull market is intact, and a breather wouldn‘t be surprising here.
Trading in financial instruments and/or cryptocurrencies involves high risks including the risk of losing some, or all, of your investment amount, and may not be suitable for all investors. Prices of cryptocurrencies are extremely volatile and may be affected by external factors such as financial, regulatory or political events. Trading on margin increases the financial risks.
Before deciding to trade in financial instrument or cryptocurrencies you should be fully informed of the risks and costs associated with trading the financial markets, carefully consider your investment objectives, level of experience, and risk appetite, and seek professional advice where needed.
Fusion Media would like to remind you that the data contained in this website is not necessarily real-time nor accurate. The data and prices on the website are not necessarily provided by any market or exchange, but may be provided by market makers, and so prices may not be accurate and may differ from the actual price at any given market, meaning prices are indicative and not appropriate for trading purposes. Fusion Media and any provider of the data contained in this website will not accept liability for any loss or damage as a result of your trading, or your reliance on the information contained within this website.
It is prohibited to use, store, reproduce, display, modify, transmit or distribute the data contained in this website without the explicit prior written permission of Fusion Media and/or the data provider. All intellectual property rights are reserved by the providers and/or the exchange providing the data contained in this website.
Fusion Media may be compensated by the advertisers that appear on the website, based on your interaction with the advertisements or advertisers.