Navigating NASDAQ 100 Stats
| Jul 07, 2021 02:49AM ET
NASDAQ 100 Entry/Exit Points
Volume-weighted GR-Estimator as a Technical Indicator.
Risk-cybernetics is applied to the GR-Estimator as a technical indicator for the NASDAQ 100 (NDX) (>$15T market cap) which includes trading volume and golden-ratio segments as input parameters, computed with genetic-optimization.
The quantification of risk is probably the most important activity for investments. Both public and private sectors spend millions on beefing up infrastructure for the purpose of enhancing risk management processes.
Here we provide the Volume-weighted GR-Estimator (VWGRE or vGRE*) which helps account for the self-fulfilling prophecy in technical analysis.
First, here is a summary of the more commonly used volume-related technical indicators.
Positive Volume Index (PVI) provides signals for price changes based on positive increases in trading volume. The PVI helps in assessing trend strength and potentially confirming price reversals. PVI tracks the crowd, whose activity is typically associated with higher volume days. The crowd typically loses money, or fairs less well than professional traders.
The Negative Volume Index (NVI) looks at lower volume days, which are associated with professional trader activity, and not the crowd. Therefore, NVI shows what the “smart money” is doing.
On Balance Volume (OBV) is a running total of positive and negative volume, based on whether the price today was higher or lower than the price yesterday, respectively. OBV is a technical indicator of momentum, using volume changes to make price predictions. OBV shows crowd sentiment that can predict a bullish or bearish outcome.
Trade Volume Index (TVI) is a technical indicator that moves significantly in the direction of a price trend when substantial price changes and volume occur simultaneously. Unlike many technical indicators, the TVI is generally created using intraday price data.
The Intraday Intensity Index (III) is used to track how volume is influencing a security’s price. The index uses a security’s most recent close, high and low in its calculation while also factoring in volume. For example, when intraday highs and lows move above the closing price with volume, then the index will move sharply negative.
Volume-weighted Average Price (VWAP) is an important tool to track the average price of a security over a certain period of time.
Typically, traders and analysts use the standard VWAP, which calculates the price based on all of the orders for the trading day. Traders use the VWAP to eliminate the noise that occurs throughout the day, so they can gauge what prices buyers and sellers are really trading at on the stock or the market.
Moving Volume-weighted Average Price (MVWAP) is a user-defined the average of VWAP calculations and has no final value as it can run fluidly from one day to the next.
The MVWAP may be used by longer-term traders, but VWAP only looks at one day at a time due to its intraday calculation. Both indicators are a special type of price average that takes into account volume which provides a much more accurate snapshot of price action.
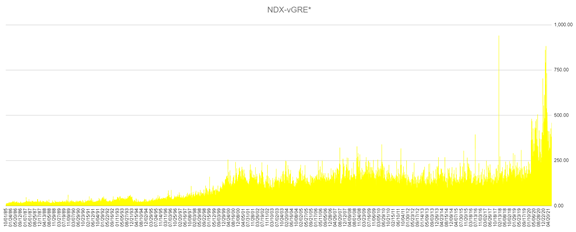
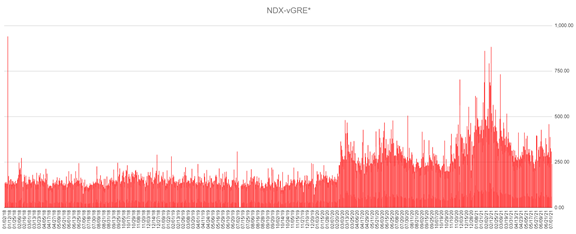
The Volume-weighted GR-Estimator (VWGRE) incorporates a random parameter optimization function based on the Golden-Ratio (GR) where GR≈1.618.
Following chart presents the NDX: VWGRE from 1-Oct-85 to 2-Jul-21.
The inputs of open price, high price, low price, close price are split into line segments a and b where:
a = | minimum price minus mean price |
b = | mean price minus maximum price |
where a>b : hypothesized ratio=1.618
where b>a : hypothesized ratio=0.618
We then compute the Genetic-Factor (GF) via our proprietary genetic-optimization process where the GF-estimate is an optimized best-fit result between 0 to 1.618 subject to the calculated a and b data as constraints.
The GR-Estimator (GRE) is computed as GF/GR and the VWGRE is the adjusted (GF/GR) for easy reference, multiplied by the trading volume in that period.
The VWGRE is thus a technical indicator that reflects the potential volume-weighted price change and any spike represents a potential downside that can be a potential short or exit, while a dip represents a potential upside that can be a good entry point.
This serves as a check with other familiar technical indicators and addresses the self-fulfilling prophecy debate with volume-weighted optimization.
The database of Daily-VWGRE on NASDAQ 100 (the best-performing index in the past decade with >18% non-leveraged annualized returns) and other value-added statistics are published weekly every Monday from Oct-1985 in Finamatrix.AI with password-protection (sharing of password is prohibited with IP tracking).
To LOGIN, please register for free trial.
Trading in financial instruments and/or cryptocurrencies involves high risks including the risk of losing some, or all, of your investment amount, and may not be suitable for all investors. Prices of cryptocurrencies are extremely volatile and may be affected by external factors such as financial, regulatory or political events. Trading on margin increases the financial risks.
Before deciding to trade in financial instrument or cryptocurrencies you should be fully informed of the risks and costs associated with trading the financial markets, carefully consider your investment objectives, level of experience, and risk appetite, and seek professional advice where needed.
Fusion Media would like to remind you that the data contained in this website is not necessarily real-time nor accurate. The data and prices on the website are not necessarily provided by any market or exchange, but may be provided by market makers, and so prices may not be accurate and may differ from the actual price at any given market, meaning prices are indicative and not appropriate for trading purposes. Fusion Media and any provider of the data contained in this website will not accept liability for any loss or damage as a result of your trading, or your reliance on the information contained within this website.
It is prohibited to use, store, reproduce, display, modify, transmit or distribute the data contained in this website without the explicit prior written permission of Fusion Media and/or the data provider. All intellectual property rights are reserved by the providers and/or the exchange providing the data contained in this website.
Fusion Media may be compensated by the advertisers that appear on the website, based on your interaction with the advertisements or advertisers.