Natural Gas Trading Below Main Support Could Trigger Selling Spree
Satendra Singh | May 27, 2025 12:54PM ET
Despite a gap-up opening on Apr. 29, 2025, after finding strong support at $2.857, natural gas futures continued to face stiff resistance at the 100 DMA at $3.722 due to the formation of a bearish crossover when the 50 DMA pierced the 100 DMA in the daily chart.
Undoubtedly, light demand for natural gas has capped the upside for the natural gas futures as the natgasweather.com reports indicate that the eastern half of the US will see showers, thunderstorms, and highs of the 60s-70s while Texas and the South cooling several degrees and into the 70s-80s besides locally hotter 90s will keep the national demand low for the next 7-8 days.
On the other hand, Sunday’s move by US President Donald Trump to postpone plans to impose steep trade tariffs on the European Union, potentially averting a costly trade war could keep the natural gas prices low as Mr. Trump could further move to resolve trade relations with major trading partners of the U.S.
I anticipate that such a move by President Donald Trump will keep the commodity prices in check as this helps to evaporate the recessionary fear and further such steps will result in price exhaustion, especially in energy prices which surged after the declaration of a national energy emergency on joining of Mr. Trump on Jan. 20 this year.
However, the natural gas futures tested a new high on Mar. 10, 2025, at $4.907 amid growing geo-political concerns, but the advent of spring season resulted in a selling spree since Mar. 11 that pushed the natural gas futures to test the lows at $2.857 on Apr. 24, 2025.
Undoubtedly, natural gas futures started to bounce back from these lows but the upside seems limited as the summer cooling demand is yet far away.
On the other hand, inventory levels have not shown any withdrawal for a long time has swollen the stockpiles indicating advent of price exhaustion is likely to continue if weather remains as it is for some more time.
Technical Levels to Watch
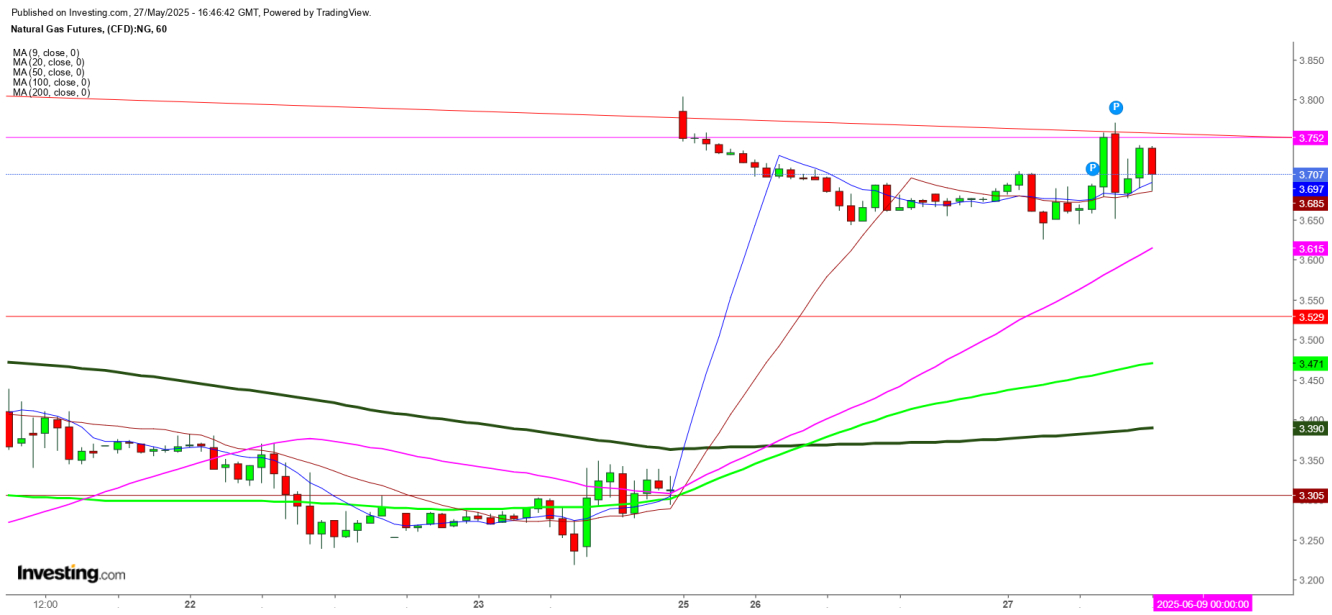
In the hourly chart
, natural gas futures showing bearish engulfing that could result in price reversal shortly if not find a breakout above the immediate resistance at $3.752, next targets could be at $3.615, $3.472, and $3.390.
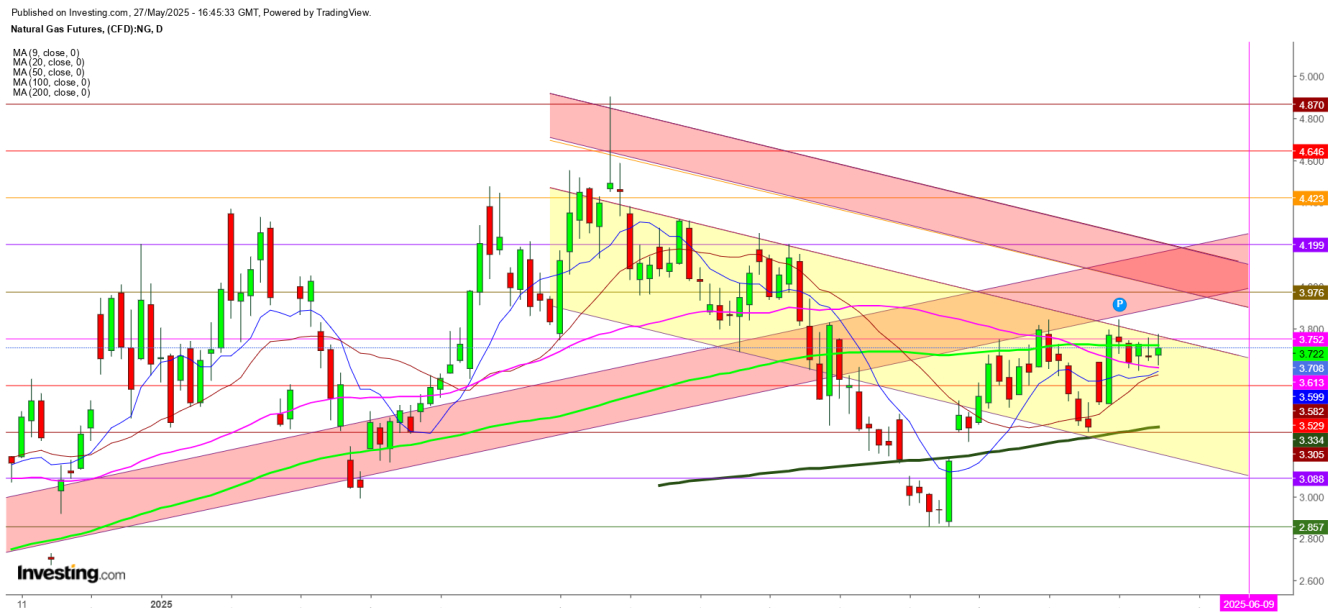
, natural gas futures are attempting to find a breakout above the significant resistance at the 100 DMA at $3.722 since last few day but the formation of a bearish crossover with a downward move by the 50 DMA below the 100 DMA could extend bearish pressure this week.
Undoubtedly, the natural gas futures are still sustaining above the 50 DMA at $3.612 making the situation in favor of the bulls but their inability to sustain the prices above the 100 DMA at $3.722 will attach big bears at this level.
In the weekly chart
, natural gas futures are trading below the significant resistance at 200 DMA at $3.938 could keep the natural gas futures in bearish territory due to the formation of a ‘Hanging Man’, indicating a selling spree is likely to continue till the generation of cooling demand next month.
Inversely, any upward move will face stiff resistance at the 200 DMA at $3.938.
Disclaimer: Readers are advised to take any position in natural gas futures at their own risk as this analysis is based only on the observations.
Trading in financial instruments and/or cryptocurrencies involves high risks including the risk of losing some, or all, of your investment amount, and may not be suitable for all investors. Prices of cryptocurrencies are extremely volatile and may be affected by external factors such as financial, regulatory or political events. Trading on margin increases the financial risks.
Before deciding to trade in financial instrument or cryptocurrencies you should be fully informed of the risks and costs associated with trading the financial markets, carefully consider your investment objectives, level of experience, and risk appetite, and seek professional advice where needed.
Fusion Media would like to remind you that the data contained in this website is not necessarily real-time nor accurate. The data and prices on the website are not necessarily provided by any market or exchange, but may be provided by market makers, and so prices may not be accurate and may differ from the actual price at any given market, meaning prices are indicative and not appropriate for trading purposes. Fusion Media and any provider of the data contained in this website will not accept liability for any loss or damage as a result of your trading, or your reliance on the information contained within this website.
It is prohibited to use, store, reproduce, display, modify, transmit or distribute the data contained in this website without the explicit prior written permission of Fusion Media and/or the data provider. All intellectual property rights are reserved by the providers and/or the exchange providing the data contained in this website.
Fusion Media may be compensated by the advertisers that appear on the website, based on your interaction with the advertisements or advertisers.