Natural Gas: No Reversal in Sight as Lower Levels Loom
Satendra Singh | Apr 24, 2025 11:53AM ET
Upon analyzing the moves of the natural gas futures since I wrote my on Apr. 2, 2025 — when prices were hovering just below the significant resistance level at $4.20 — it was clear that most investors were reluctant to believe a steep decline was imminent, despite the onset of spring and rising energy market volatility driven by Trump’s Energy Emergency.
Undoubtedly, recent developments on the trade tariff front have added to the bearish pressure on natural gas futures. Even as inventories rise, speculation about a potential trend reversal continues to grow.
In this critical climate of mounting global economic uncertainty, the production cost of natural gas is likely to increase, while supply options are narrowing due to the sharp escalation in trade and retaliatory tariffs.
Amid climate-related shifts and a tightening supply, natural gas futures now trade at a pivotal juncture — yet meaningful support remains significantly lower.
Technical Levels to Watch
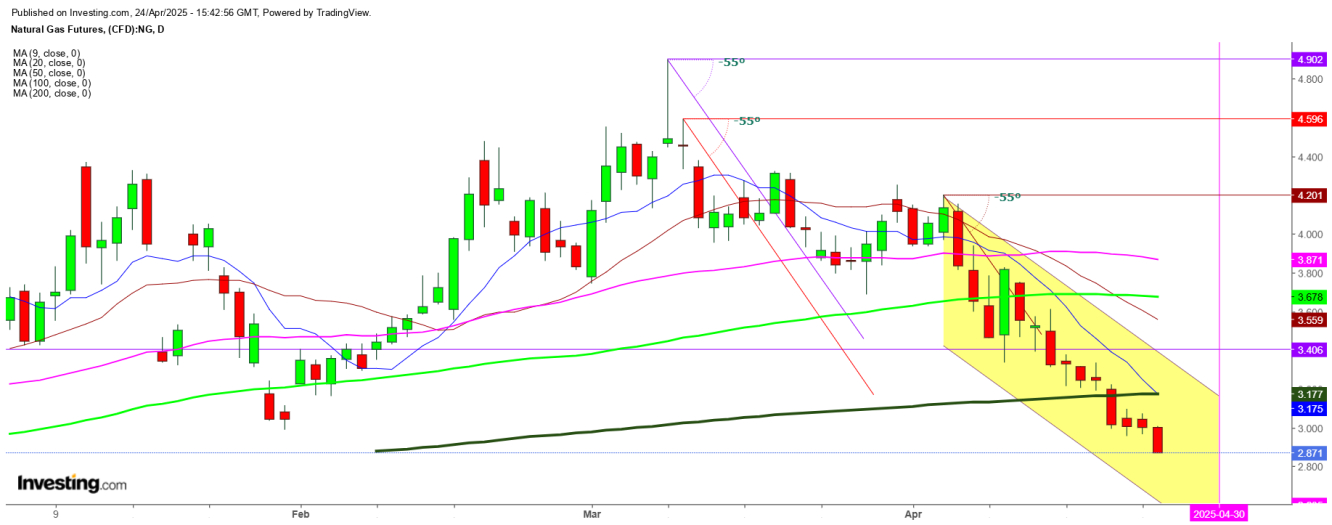
On the daily chart, natural gas futures have been on a steady decline since April 3, following a test of this month’s high at $4.201. The breakdown below key support levels — the 50-day moving average (DMA) at $3.872, the 100 DMA at $3.677, and the 200 DMA at $3.177 — signals that the long-term bearish trend remains intact, reinforced by a series of bearish crossovers.
The 9 DMA has now crossed below the 20, 50, 100, and most recently the 200 DMA, confirming a strong bearish formation. With all major moving averages now acting as overhead resistance, natural gas futures show no signs of reversal at the current levels.
I anticipate that the ongoing bearish pressure could intensify following the release of weekly inventory data, scheduled for two hours from now.
In this context, natural gas futures may test the next downside targets at $2.604 and $2.453 before the end of the month.
Undoubtedly, any reversal will require the price to first stabilize at a sustainable support level.
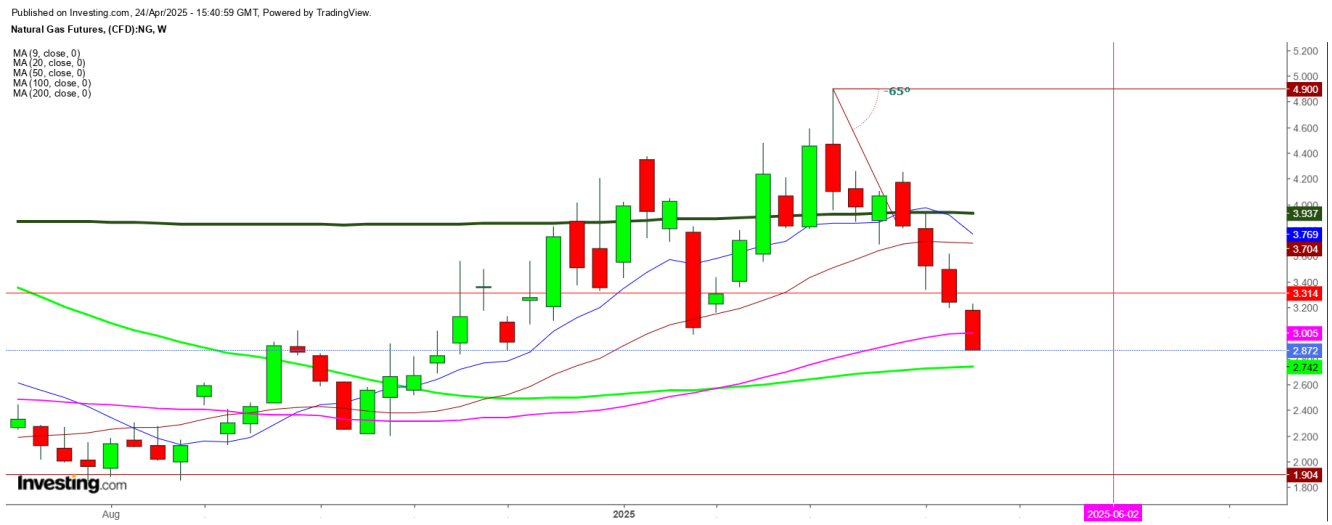
On the weekly chart, natural gas futures confirm a long-term downtrend that is expected to persist until cooling demand returns — a seasonal shift that could significantly impact prices, especially amid supply constraints, rising inventory levels, and persistent inflationary pressures.
Technically, natural gas has been in a sustained downtrend since the last week of January 2025, breaking below the 200-day moving average (DMA) at $3.937. While some support may emerge near the 100 DMA at $2.742, a decisive breakdown below this level could trigger further downside, particularly as the 100 DMA now sits below the 200 DMA — a classic bearish signal suggesting continued weakness through the end of the month.
Conversely, if futures find support at the 100 DMA and manage to hold above it, a short-term rebound may be possible. However, in the absence of sustained buying, any upward move is likely to be met with selling pressure.
Overall, I anticipate that natural gas futures may remain under bearish pressure for the remainder of this year, with a potential reversal not expected until 2026.
Trading in financial instruments and/or cryptocurrencies involves high risks including the risk of losing some, or all, of your investment amount, and may not be suitable for all investors. Prices of cryptocurrencies are extremely volatile and may be affected by external factors such as financial, regulatory or political events. Trading on margin increases the financial risks.
Before deciding to trade in financial instrument or cryptocurrencies you should be fully informed of the risks and costs associated with trading the financial markets, carefully consider your investment objectives, level of experience, and risk appetite, and seek professional advice where needed.
Fusion Media would like to remind you that the data contained in this website is not necessarily real-time nor accurate. The data and prices on the website are not necessarily provided by any market or exchange, but may be provided by market makers, and so prices may not be accurate and may differ from the actual price at any given market, meaning prices are indicative and not appropriate for trading purposes. Fusion Media and any provider of the data contained in this website will not accept liability for any loss or damage as a result of your trading, or your reliance on the information contained within this website.
It is prohibited to use, store, reproduce, display, modify, transmit or distribute the data contained in this website without the explicit prior written permission of Fusion Media and/or the data provider. All intellectual property rights are reserved by the providers and/or the exchange providing the data contained in this website.
Fusion Media may be compensated by the advertisers that appear on the website, based on your interaction with the advertisements or advertisers.