Natural Gas: Is a Bottom in Sight?
Michele Schneider | May 03, 2024 02:28AM ET
A big story last week was that AI is fueled by natural gas, which should increase demand.
That story did little for the futures price.
Then this week other stories came out that:
- Prices were supported by higher feed gas flows to Freeport LNG and lower U.S. production.
- Chesapeake Energy (NYSE:CHK) decides to maintain output curtailments.
- Com says that a hot forecast for Texas could also lift demand for power generation.
We also just learned that the weekly build in inventories came in roughly in line with expectations which was received with a rise in prices as of today.
Year-to-date, natural gas prices are down nearly 40%.
Analysts believe that solar will replace the need for natgas, but can the US power grid sustain the growth in demand?
After all, good or smart business generally goes the way of the cheapest fix, and not necessarily the one that is better ecologically.
Be that as it may, it’s the charts that keep us on the ride side.
Let’s have a look.
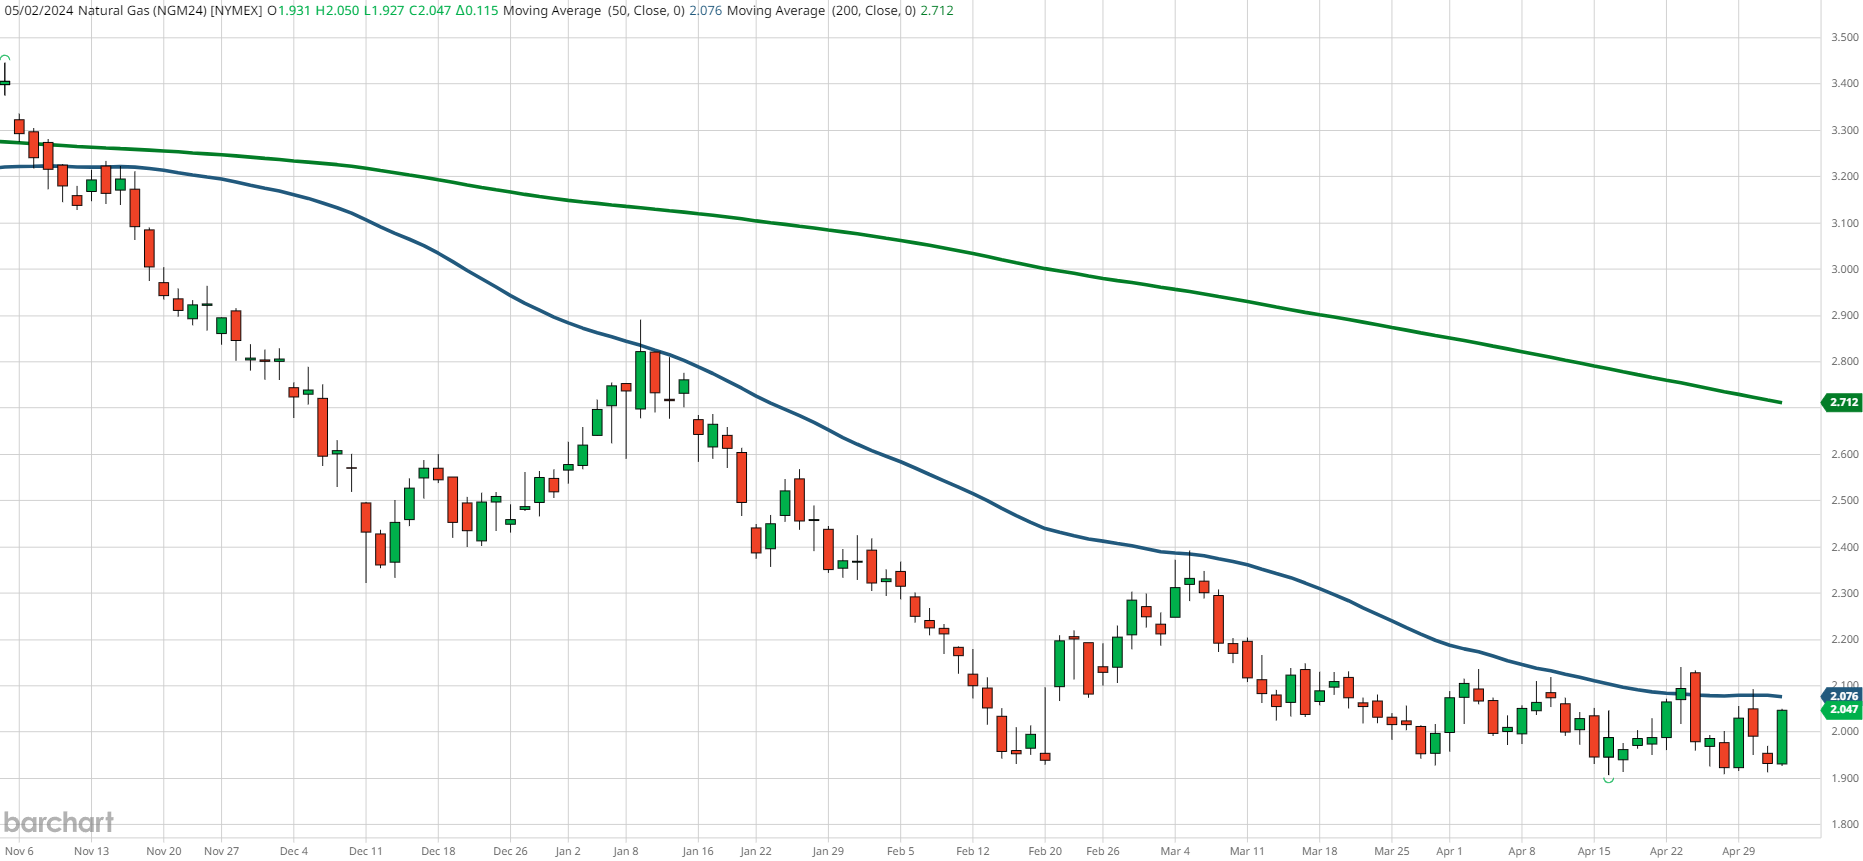
On the futures chart, June contract, the answer looks simple.
Wait for 2 closes over the 50-DMA and the phase change to recuperation will confirm.
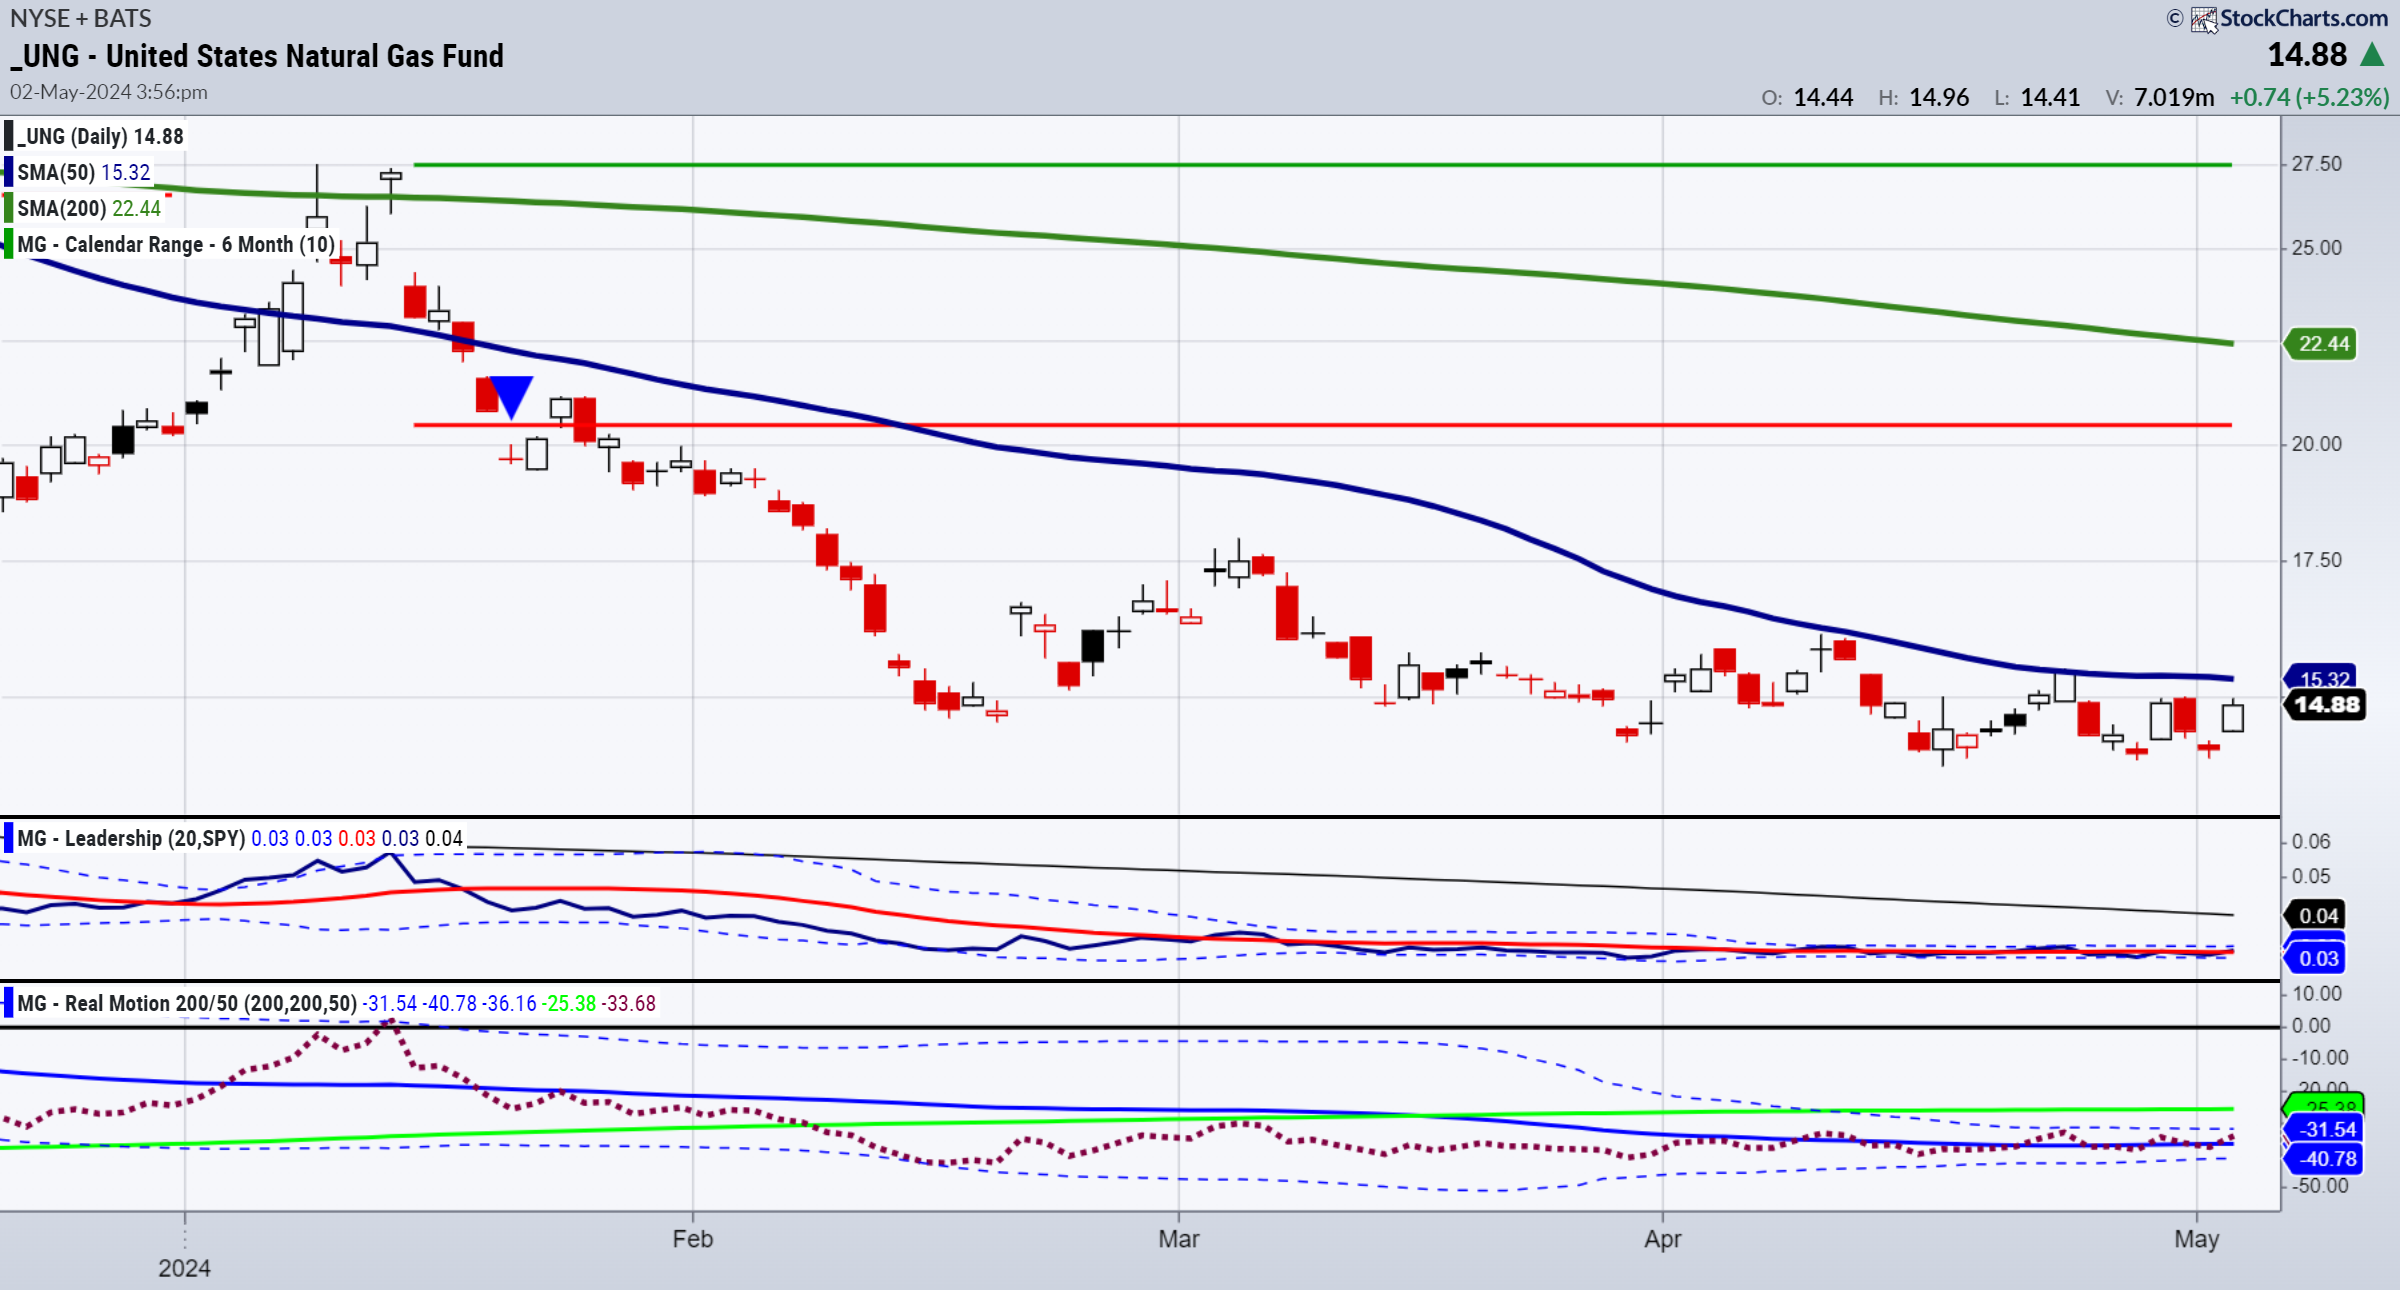
The ETF UNG is another option to watch, however, as I have noted many times before, the underlying commodity should drive investment decisions.
In the chart, we see consistency in that UNG has yet to clear the 50-DMA to a better phase.
What I find interesting here is that our real motion indicator has a bullish diversion with price over the 50-DMA.
Plus, our leadership indicator at this point shows UNG trading on par with the benchmark.
ETF Summary
- S&P 500 (SPY) Still in a caution phase-500 now support 511 the 50-DMA resistance
- Russell 2000 (IWM) Still in a caution phase-190 support 200-202 resistance
- Dow (DIA) Still in a caution phase 380 support 388 resistance
- Nasdaq (QQQ) Still in a caution phase 430 pivotal
- Regional banks (KRE) 45-50 range
- Semiconductors (SMH) Still in a caution phase 204 Support 220 resistance
- Transportation (IYT) 63 support 67 resistance
- *Biotechnology (IBB) Unconfirmed from bearish to recuperation phase
- Retail (XRT) 71.50 support 75 resistance
- iShares iBoxx Hi Yd Cor Bond ETF (HYG) 76.50 pivotal
Trading in financial instruments and/or cryptocurrencies involves high risks including the risk of losing some, or all, of your investment amount, and may not be suitable for all investors. Prices of cryptocurrencies are extremely volatile and may be affected by external factors such as financial, regulatory or political events. Trading on margin increases the financial risks.
Before deciding to trade in financial instrument or cryptocurrencies you should be fully informed of the risks and costs associated with trading the financial markets, carefully consider your investment objectives, level of experience, and risk appetite, and seek professional advice where needed.
Fusion Media would like to remind you that the data contained in this website is not necessarily real-time nor accurate. The data and prices on the website are not necessarily provided by any market or exchange, but may be provided by market makers, and so prices may not be accurate and may differ from the actual price at any given market, meaning prices are indicative and not appropriate for trading purposes. Fusion Media and any provider of the data contained in this website will not accept liability for any loss or damage as a result of your trading, or your reliance on the information contained within this website.
It is prohibited to use, store, reproduce, display, modify, transmit or distribute the data contained in this website without the explicit prior written permission of Fusion Media and/or the data provider. All intellectual property rights are reserved by the providers and/or the exchange providing the data contained in this website.
Fusion Media may be compensated by the advertisers that appear on the website, based on your interaction with the advertisements or advertisers.