NASDAQ Breadth Metrics Break Down As Russell 2000 Cracks
Declan Fallon | Oct 03, 2018 12:15AM ET
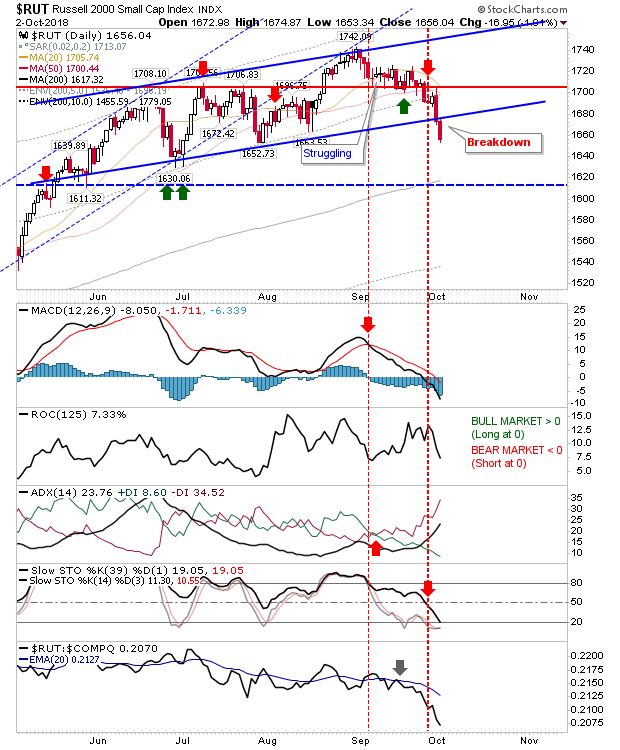
A mixed bag of events for markets yesterday as some moved while others remained unchanged. The Russell 2000 made a key move lower as it broke channel support. Relative performance widened its losses as declines were logged. The next target is the 200-day MA.
For the last six months, NASDAQ breadth metrics have consolidated into a triangle but this all changed yesterday. The biggest change in the NASDAQ Bullish Percents was the well-marked breakdown on very weak technicals.
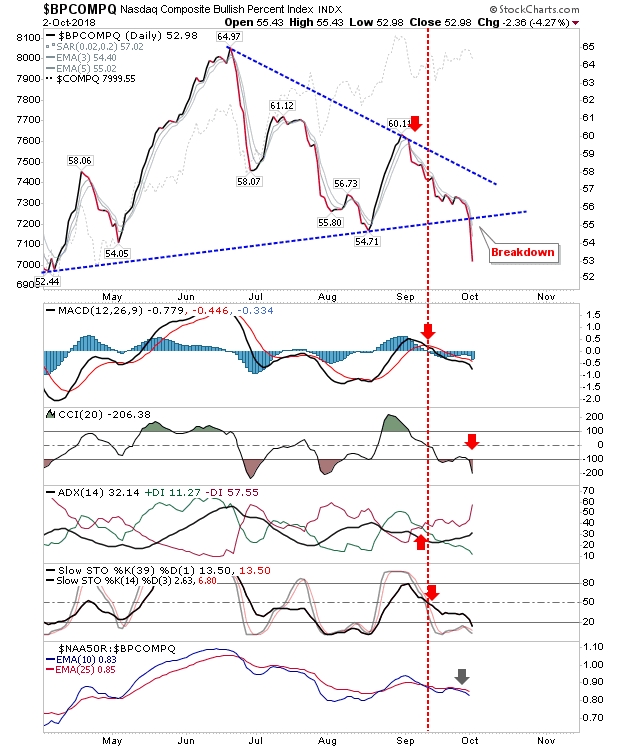
This weakness spread to other breadth metrics such as the Percentage of NASDAQ stocks above the 50-day MA and Summation Index.
What this means for the NASDAQ is troublesome. The index broke channel support and has bumped along just beneath this support. Yesterday also saw a MACD trigger 'sell' and an On-Balance-Volume 'sell'. The aforementioned NASDAQ breadth metrics suggest this index is heading lower.
The S&P didn't do a whole lot yesterday; the narrow range doji held support for another day but with the Russell 2000 and NASDAQ under pressure, the chances of it following suit lower are quite high.
The index that's bucking the trend is the Dow Jones Industrial Average. Yesterday's gain effectively negated the bearish evening star as it continues to move towards channel resistance.
For today, watch for an acceleration lower in the Russell 2000 and NASDAQ, as the Dow Jones Industrials again look to diverge (and in the process make relative performance gains) from peers. From a new trade perspective, a swing trade in the S&P; buy a break of doji high's or sell a loss of its lows with a stop on the doji flip side, looks reasonable given the emerging volatility.
Trading in financial instruments and/or cryptocurrencies involves high risks including the risk of losing some, or all, of your investment amount, and may not be suitable for all investors. Prices of cryptocurrencies are extremely volatile and may be affected by external factors such as financial, regulatory or political events. Trading on margin increases the financial risks.
Before deciding to trade in financial instrument or cryptocurrencies you should be fully informed of the risks and costs associated with trading the financial markets, carefully consider your investment objectives, level of experience, and risk appetite, and seek professional advice where needed.
Fusion Media would like to remind you that the data contained in this website is not necessarily real-time nor accurate. The data and prices on the website are not necessarily provided by any market or exchange, but may be provided by market makers, and so prices may not be accurate and may differ from the actual price at any given market, meaning prices are indicative and not appropriate for trading purposes. Fusion Media and any provider of the data contained in this website will not accept liability for any loss or damage as a result of your trading, or your reliance on the information contained within this website.
It is prohibited to use, store, reproduce, display, modify, transmit or distribute the data contained in this website without the explicit prior written permission of Fusion Media and/or the data provider. All intellectual property rights are reserved by the providers and/or the exchange providing the data contained in this website.
Fusion Media may be compensated by the advertisers that appear on the website, based on your interaction with the advertisements or advertisers.