Nasdaq And The 50-Day Moving Average
Brian Gilmartin | Jun 16, 2017 09:00AM ET
With so much investment-related information data, available daily on a plethora of blogs, Twitter (NYSE:TWTR), not to mention the mainstream financial media, every week there is just an enormous amount of market-related data to sift through.
The chart below is a detail from Bespoke and notes that a trade of the Nasdaq 100 historically has meant poor forward returns through the next three months.
Here are the top-5 components of the PowerShares QQQ Trust Series 1 (NASDAQ:QQQ) and their respective market-cap weights in the key ETF:
- Apple (NASDAQ:AAPL): 11.5%
- Microsoft (NASDAQ:MSFT): +8%
- Amazon (NASDAQ:AMZN): 7%
- Facebook (NASDAQ:FB): 5.5%
- Google (NASDAQ:GOOGL) (C): 5%
The top-5 stocks in the Q comprise 36% – 37% of the QQQ market cap, according to Morningstar data.
Here is the daily QQQ chart from internal technical software, which shows a little more downside left for the Q’s to drop, before investors need to get nervous. However, note the red bar (indicates heavy volume on downside price action) which readers would like to see subside over the next week.
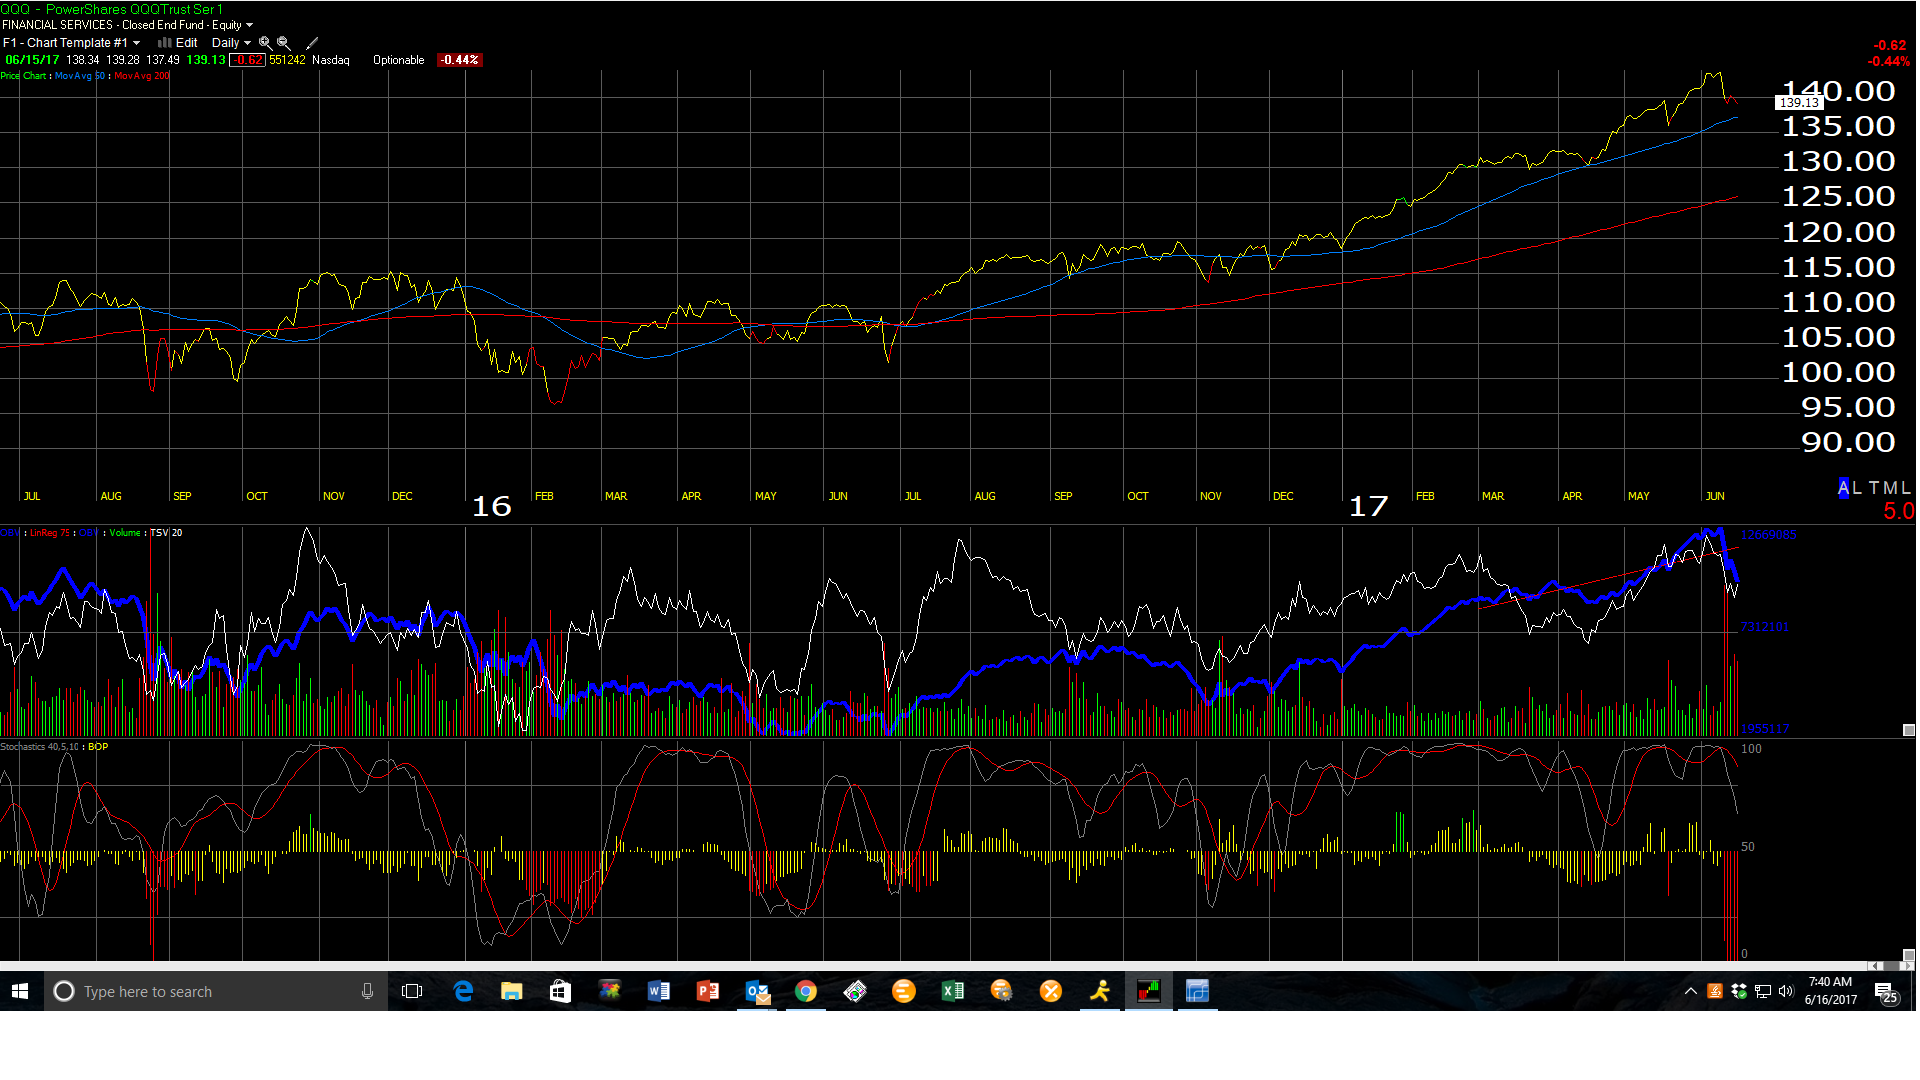
Watch the 50-day moving average for the Nasdaq 100.
The QQQE is an equal-weighted ETF that is still owned for clients, and eliminates that market cap concentration.
An earnings update will be out later tonight or Saturday morning.
![]()
Trading in financial instruments and/or cryptocurrencies involves high risks including the risk of losing some, or all, of your investment amount, and may not be suitable for all investors. Prices of cryptocurrencies are extremely volatile and may be affected by external factors such as financial, regulatory or political events. Trading on margin increases the financial risks.
Before deciding to trade in financial instrument or cryptocurrencies you should be fully informed of the risks and costs associated with trading the financial markets, carefully consider your investment objectives, level of experience, and risk appetite, and seek professional advice where needed.
Fusion Media would like to remind you that the data contained in this website is not necessarily real-time nor accurate. The data and prices on the website are not necessarily provided by any market or exchange, but may be provided by market makers, and so prices may not be accurate and may differ from the actual price at any given market, meaning prices are indicative and not appropriate for trading purposes. Fusion Media and any provider of the data contained in this website will not accept liability for any loss or damage as a result of your trading, or your reliance on the information contained within this website.
It is prohibited to use, store, reproduce, display, modify, transmit or distribute the data contained in this website without the explicit prior written permission of Fusion Media and/or the data provider. All intellectual property rights are reserved by the providers and/or the exchange providing the data contained in this website.
Fusion Media may be compensated by the advertisers that appear on the website, based on your interaction with the advertisements or advertisers.