NASDAQ 100's Downside Target Zone Reached; What's Next?
Dr. Arnout ter Schure | Aug 24, 2022 02:20PM ET
Last week (see here), I found that the NASDAQ 100 (NDX):
"I will be looking for a low around $13,000+/-200 from where the next leg is higher to ideally $14,200+/-200 kicks in. Due to the extension, it means support has now been raised to the $12,900 level. Below it, on a daily closing basis, the red path becomes much more likely with (red) wave-b down to ideally $12,100 before red wave-c kicks in."
The index has, so far, bottomed in the low- to mid $12,800s this week. See Figure 1 below.
However, the decline from last week's high appears five Elliott Wave Principle (EWP) waves lower. Since (green) wave b/2 was IMHO a running flat, which took almost a month to complete, the rule of alternation tells me that IF this is a wave-4, it will either be a triangle or a zigzag, and it should also take several weeks to complete. The former corrective pattern has an internal 3-3-3 path, whereas the latter is a 5-3-5.
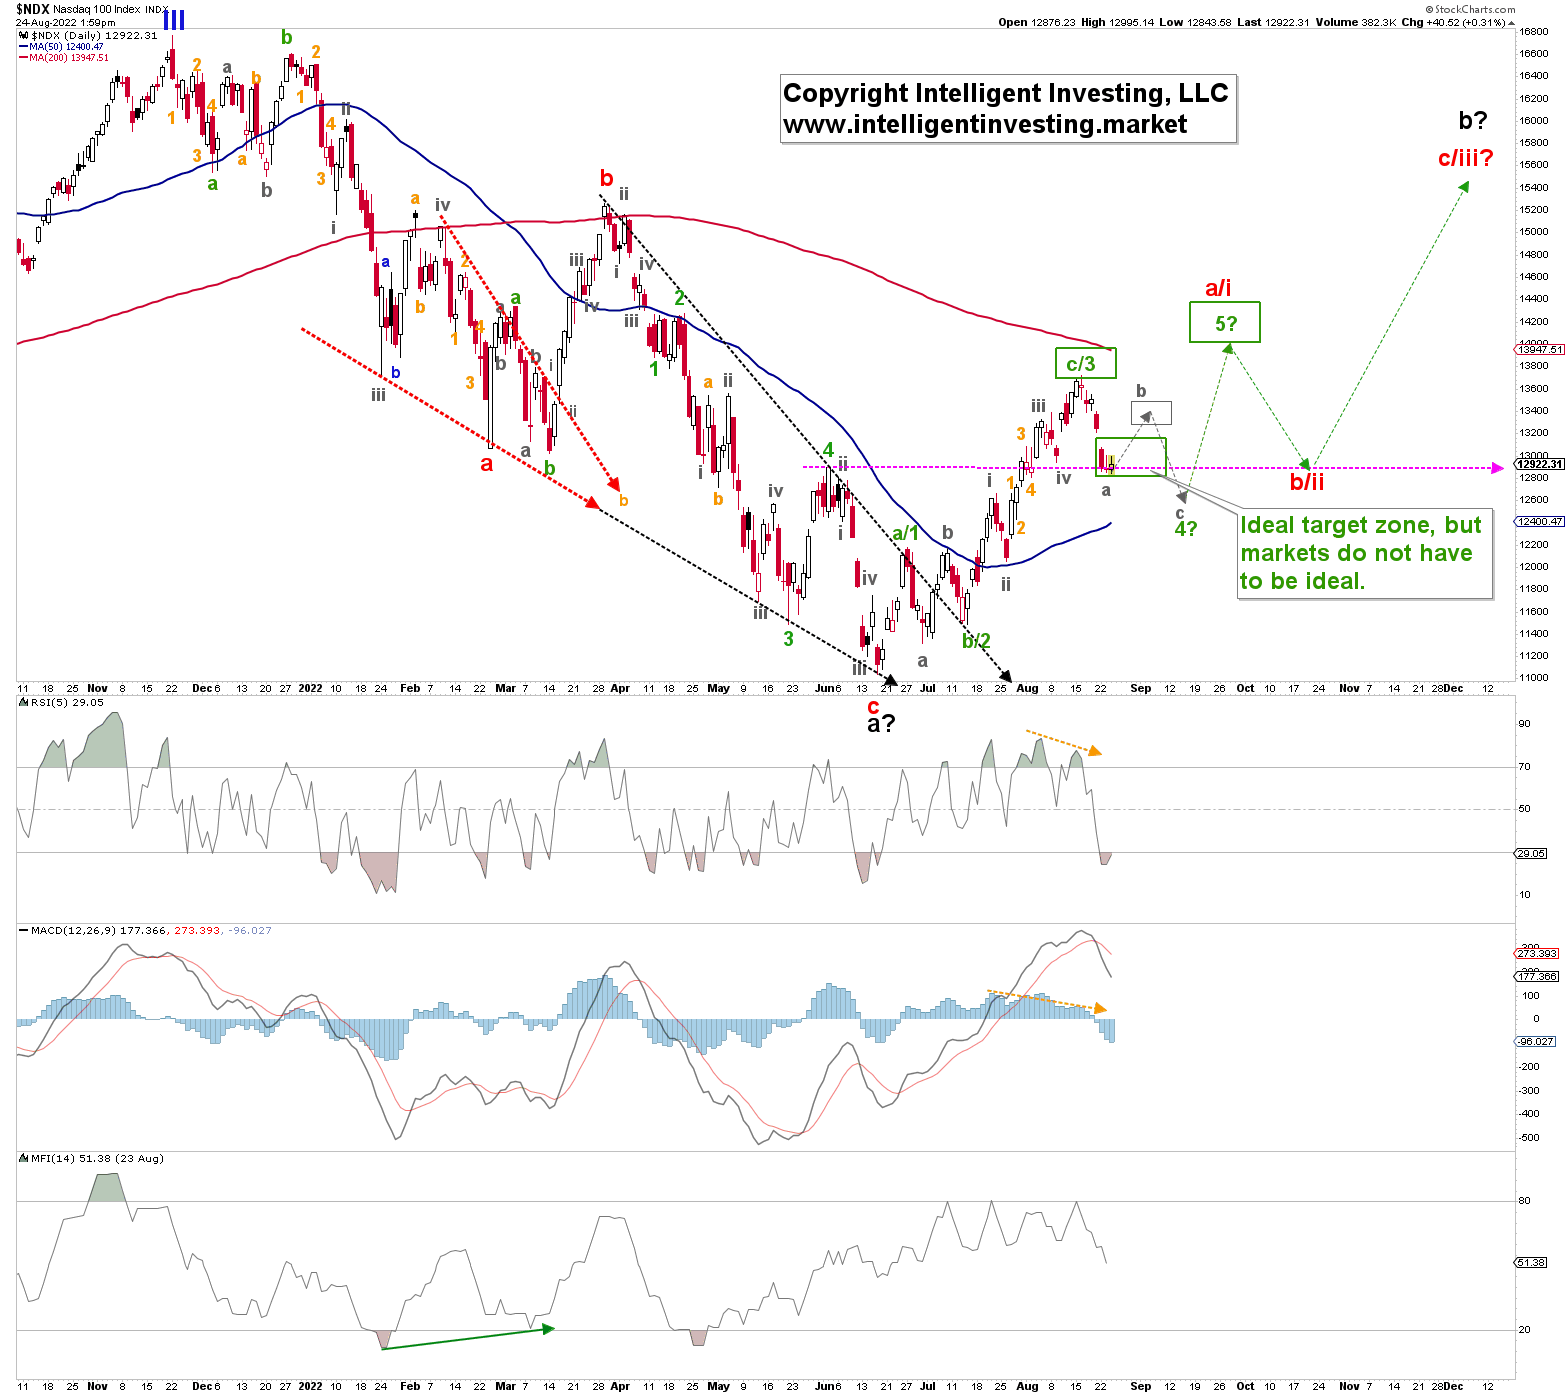
Figure 1. NASDAQ 100 daily candlestick chart with detailed EWP count and technical indicators
I expect a bounce soon with five waves lower about complete: grey wave-b. It should target based on current data, ideally around $13400+/-100. The c-wave should kick in to complete the correction at ideally $12,500+/-100.
Bottom Line
As shared last week, the NDX has only done three waves up from the June low and has already reached the $13,000+/-200 target zone. In this article, I continue with the five waves up bullish possibility.
The Bulls must complete the 4th wave in a zigzag (a-b-c) pattern to accomplish this pattern. Wave-a is about to finish, wave-b should rally the index back to around $13400+/-100, and then wave-c should ideally target around $12,500+/-100. This level is slightly lower than the $12,900 level identified last week. Still, since the current decline has already reached the lower end of the ideal target zone, one must adjust accordingly: anticipate, monitor, and adjust.
![]()
Trading in financial instruments and/or cryptocurrencies involves high risks including the risk of losing some, or all, of your investment amount, and may not be suitable for all investors. Prices of cryptocurrencies are extremely volatile and may be affected by external factors such as financial, regulatory or political events. Trading on margin increases the financial risks.
Before deciding to trade in financial instrument or cryptocurrencies you should be fully informed of the risks and costs associated with trading the financial markets, carefully consider your investment objectives, level of experience, and risk appetite, and seek professional advice where needed.
Fusion Media would like to remind you that the data contained in this website is not necessarily real-time nor accurate. The data and prices on the website are not necessarily provided by any market or exchange, but may be provided by market makers, and so prices may not be accurate and may differ from the actual price at any given market, meaning prices are indicative and not appropriate for trading purposes. Fusion Media and any provider of the data contained in this website will not accept liability for any loss or damage as a result of your trading, or your reliance on the information contained within this website.
It is prohibited to use, store, reproduce, display, modify, transmit or distribute the data contained in this website without the explicit prior written permission of Fusion Media and/or the data provider. All intellectual property rights are reserved by the providers and/or the exchange providing the data contained in this website.
Fusion Media may be compensated by the advertisers that appear on the website, based on your interaction with the advertisements or advertisers.