NASDAQ 100 Update: Will It Ever Go Down Again?
Dr. Arnout ter Schure | Sep 01, 2020 05:01PM ET
The Nasdaq 100 has certainly surprised many to the upside, me included.
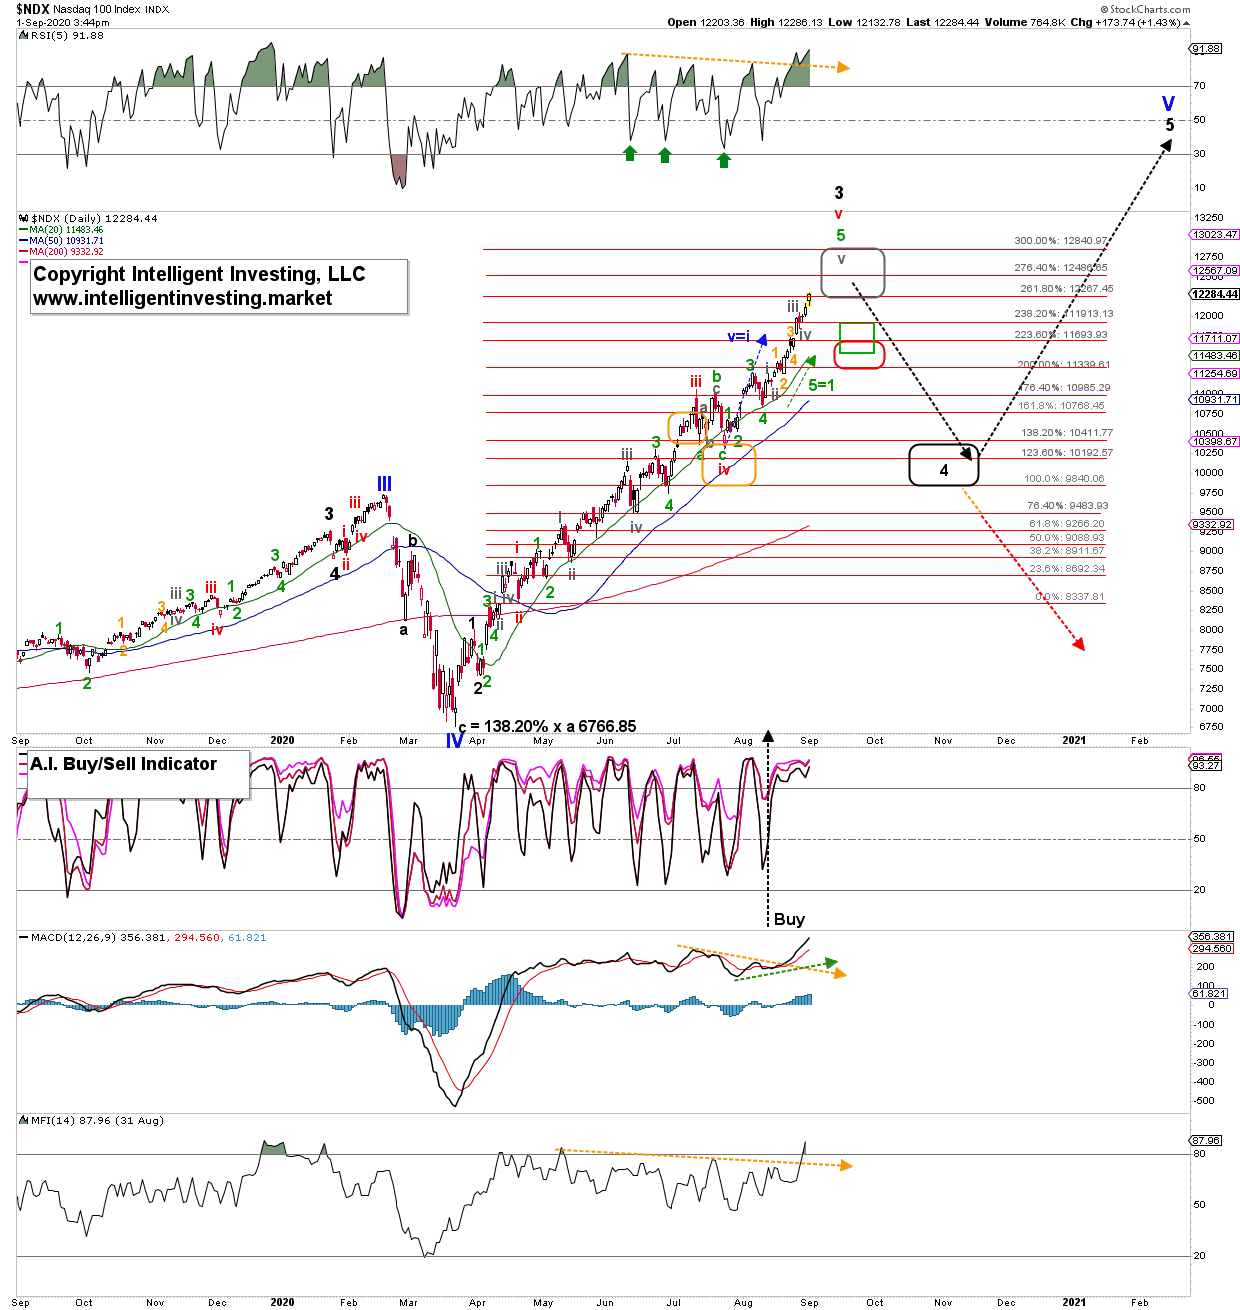
My first ideal upside target zone was for many weeks $11,600-$11,700. It was easily reached. Then, as that zone was exceeded, and although I found it less likely based on applying normal wave-relationships (dotted green, and blue arrows) and not extended wave-paramaters, I was looking for $11,880 to be reached for a larger top. Also, this has now been exceeded as the waves continue to subdivide higher. See Figure 1 below.
As I said in prior updates,“Subdividing waves occur often in the third wave or fifth wave. However, one simply cannot know before hand which of the two waves will subdivide. And even then both waves can subdivide. That is why all one can do is:”
- anticipate (expect regular wave-relationships), then
- monitor (is price adhering to these anticipated regular relationships), and
- adjust if necessary (if not, then re-assess the waves and price targets).
The exceeding of price targets does not mean the Elliott Wave Principle is wrong or does not work. Quite the contrary. I was able to forecast these price targets would be reached. I simply did not have the data and tools available at the time to be able to foresee extensions of the waves. Because, remember, the market is a dynamic, ever-changing environment. It is never static. Hence, one must adapt one’s point of view as new price data becomes available. This is not an excuse, but an explanation of how markets work.
Figure 1. NDX 100 daily candlestick chart with EWP count.
The markets are like forecasting the weather. Weather is also a dynamic, stochastic system. If rain is forecasted for tomorrow and it rains, then the forecast was correct. But, it can rain more or less than originally was anticipated 24 hours before. This change can happen for many reasons; e.g., the weather system stalled out over the sea and picked up more moisture, or it rained out before reaching your home as it got lifted to higher altitudes.
The NDX reached the ideal (orange) target zones for (red) wave-iii and iv in July, and behaved until then very nicely granted wave-iii exceeded the zone but only for a day on a closing basis. When the NDX 100 bottomed right at the upper end of the wave-iv target zone, I could by no means know the current wave-v would extend as much as it has. I cannot predict the future, I can only make forecasts based on standard wave-relationships; e.g. the blue dotted arrow, for example. Neither does it mean that if a price target zone is reached, one should go short. The index will have to first break below prior support to tell us the uptrend has ended. Trading is not the same as forecasting. But what one can do is lighten up on long positions and/or move stops up as it is always prudent to be cautious, nimble and to protect hard-earned profits.
Thus, as all “regular” upside targets have been breached (red and green target zones), we now need to set sail for the next higher Fib-extension targets: grey box at $12,846-$12,860.
Bottom line: Over the last few weeks I “expect a more important top by late-August early-September, followed by a rough two months for stocks in general heading into the U.S. Presidential Elections.” So far, this path appears to be still travelled by the market and I see no reason to change that view. However, my 10-15%/1.5-2.5% risk/reward perspective from last week was wrong, and thus, with the new price data at hand, I update the R/R to: 15-20% / 1.5-4.5%.
Why such a high risk? Because the index is currently, IMHO, in an extended fifth wave, and those are often fully retraced during the next correction. For now, as long as last Thursday’s low (grey wave-iv) holds, I expect higher prices.
As usual, know your timeframe, trading/investing style, and always act accordingly.
Trading in financial instruments and/or cryptocurrencies involves high risks including the risk of losing some, or all, of your investment amount, and may not be suitable for all investors. Prices of cryptocurrencies are extremely volatile and may be affected by external factors such as financial, regulatory or political events. Trading on margin increases the financial risks.
Before deciding to trade in financial instrument or cryptocurrencies you should be fully informed of the risks and costs associated with trading the financial markets, carefully consider your investment objectives, level of experience, and risk appetite, and seek professional advice where needed.
Fusion Media would like to remind you that the data contained in this website is not necessarily real-time nor accurate. The data and prices on the website are not necessarily provided by any market or exchange, but may be provided by market makers, and so prices may not be accurate and may differ from the actual price at any given market, meaning prices are indicative and not appropriate for trading purposes. Fusion Media and any provider of the data contained in this website will not accept liability for any loss or damage as a result of your trading, or your reliance on the information contained within this website.
It is prohibited to use, store, reproduce, display, modify, transmit or distribute the data contained in this website without the explicit prior written permission of Fusion Media and/or the data provider. All intellectual property rights are reserved by the providers and/or the exchange providing the data contained in this website.
Fusion Media may be compensated by the advertisers that appear on the website, based on your interaction with the advertisements or advertisers.