Nasdaq 100 Update: Is 5-10% Correction Now Under Way?
Dr. Arnout ter Schure | Feb 19, 2021 03:45PM ET
In my article from two weeks ago, I forecasted the following for the Nasdaq 100 based on the Elliott Wave Principle (EWP) and technical analysis:
“… wave-5 (of red wave-iii) to reach the 200.00% extension as the 5th wave is often equal in length to the 1st wave. But 5th waves can also be shorter. Thus, the red target zone of around 13810-14125 should be the next topping area before we see a multi-week correction into the blue target box: red intermediate wave-iv. From there, another 5th wave, red intermediate-v, should carry the index to new ATHs and complete the rally that started in March 2020.”
On Tuesday at the open, the index hit 13880, which was 67p (0.5%) from the ideal (green) 176.40% Fibonacci-extension (13813) and had -as of writing- declined every day so far this week. Since 5th waves often reach the 176.40% to 200.00% extension of the 1st wave, measured from the 2nd wave low, there are now enough waves (green 1, 2, 3, 4, 5) and a perfect Fibonacci-hit in place to suggest (red) intermediate wave-iii has topped, and wave-iv is now likely underway.
See figure 1 below.
Thus, the projected path and price targets were reached to the tee. The EWP and technical analysis were, once again, right on the money.
Figure 1: NDX100 daily candlestick chart with EWP count and technical indicators.
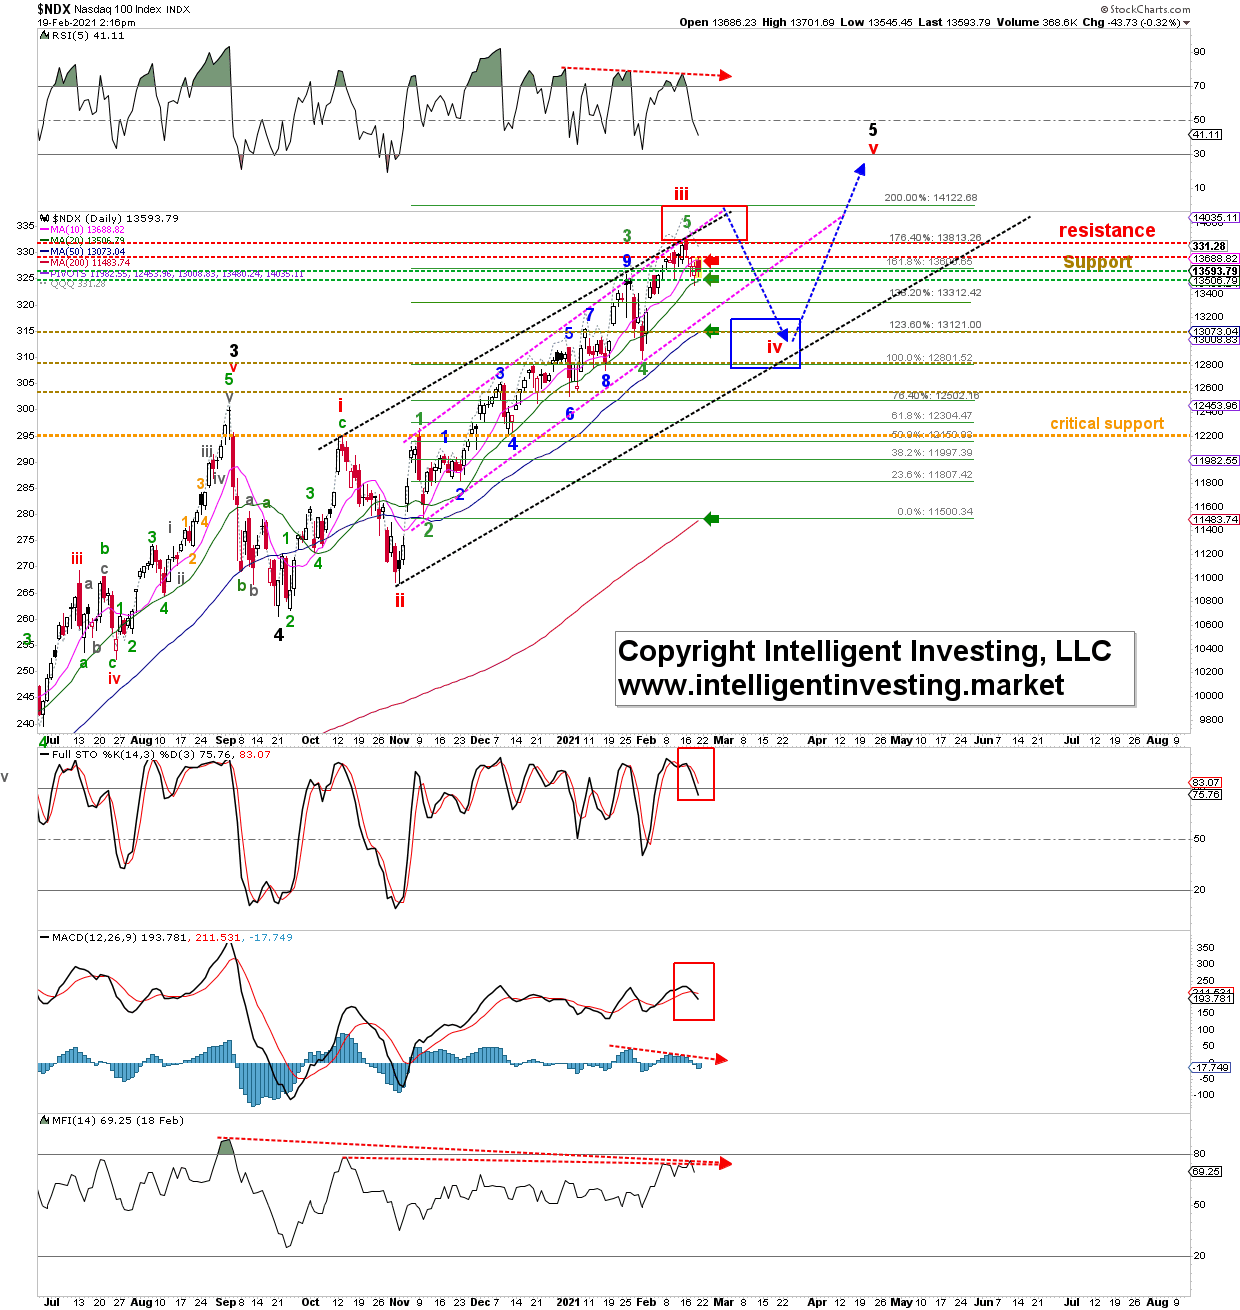
For now, the index has dropped below its rising 10-day Simple Moving Average (SMA) and tested its 20-d SMA for support yesterday. If this support gives way, I expect a rapid decline to the 50-day SMA. Such a drop will bring price nicely in the ideal blue target zone for (red) intermediate wave-iv and possibly reach the lower dotted black Elliott Wave Trendchannel-line. The RSI5 is below 50, and the Stochastic Oscillator and the MACD are on a sell (red boxes), while money flow at the recent all-time high (ATH) was less compared with early-October and late-August. When liquidity dries up, buying dries up, and only selling is left. All of which are negatives for the index.
Fourth waves are often the most variable of price structures. They can be double or triple corrections, different types of triangles or flats (aka bull flags), see here , and the exact path as we advance over the next few trading days is, therefore, muddled. The index can even make a new all-time high (called an “irregular b-wave” in EWP-terms). So, expect the unexpected.
Bottom line: Two weeks ago, I found, “[wave-iv] should see a retest of the 12830s level once again before moving higher to the low-14000s.” I can now update this to “intermediate wave-iv is now likely under way, and although it can even make a new all-time high, it should ideally target 12800-13200 before the index rallies, most likely, one last time since the rally in March 2020 started.
Trading in financial instruments and/or cryptocurrencies involves high risks including the risk of losing some, or all, of your investment amount, and may not be suitable for all investors. Prices of cryptocurrencies are extremely volatile and may be affected by external factors such as financial, regulatory or political events. Trading on margin increases the financial risks.
Before deciding to trade in financial instrument or cryptocurrencies you should be fully informed of the risks and costs associated with trading the financial markets, carefully consider your investment objectives, level of experience, and risk appetite, and seek professional advice where needed.
Fusion Media would like to remind you that the data contained in this website is not necessarily real-time nor accurate. The data and prices on the website are not necessarily provided by any market or exchange, but may be provided by market makers, and so prices may not be accurate and may differ from the actual price at any given market, meaning prices are indicative and not appropriate for trading purposes. Fusion Media and any provider of the data contained in this website will not accept liability for any loss or damage as a result of your trading, or your reliance on the information contained within this website.
It is prohibited to use, store, reproduce, display, modify, transmit or distribute the data contained in this website without the explicit prior written permission of Fusion Media and/or the data provider. All intellectual property rights are reserved by the providers and/or the exchange providing the data contained in this website.
Fusion Media may be compensated by the advertisers that appear on the website, based on your interaction with the advertisements or advertisers.