NASDAQ 100 Update: How Much More Downside To Come?
Dr. Arnout ter Schure | Sep 15, 2020 01:52PM ET
Two weeks ago, on Sept. 1, it seemed the markets would never go down. And I explained why the Nasdaq 100 moved higher than what can be anticipated based on standard Elliott Wave Principle (EWP) wave-relationships and Fibonacci-extensions. I warned about the increasing downside risks. See my article here .
I concluded:
“Thus, as all ‘regular’ upside targets have been breached, we now need to set sail for the next higher Fib-extension targets: grey box at $12846-12860 … and with the new price data at hand I update the [risk/reward ratio] R/R to 15-20% / 1.5-4.5%. Why such a high risk? Because the index is currently, in my humble opinion, in an extended 5th wave, and those are often fully retraced during the next correction.”
Fast forward, and the NDX topped at $12439 on Sept. 2, one day after my update, adding 1%. It then staged its fastest 10% drop in its history the following three trading days, erasing more than one-month's worth of gains. Thus, my updated target zone and risk/reward ratio were correct.
Figure 1.
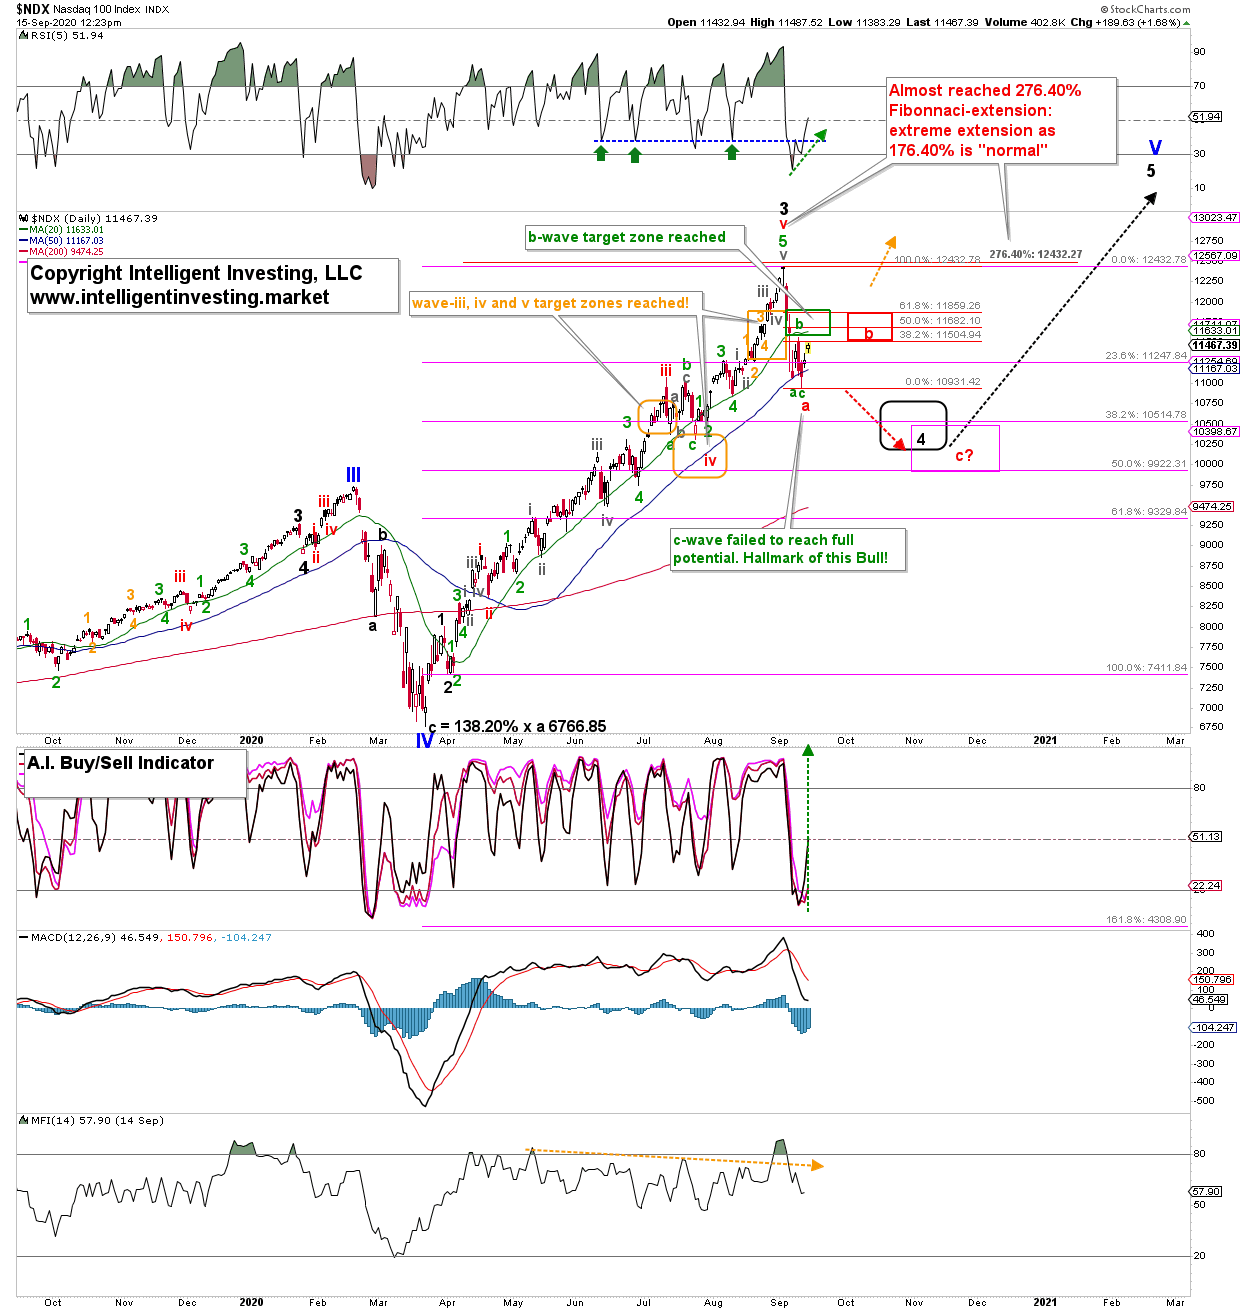
After the three-day drop, I told my Premium Major Market members to expect a bounce back to $11580-11905 before the next leg lower would kick in (green wave-b and c; respectively). The green b-wave did what it did, but the anticipated leg lower (green wave-c) failed to reach its ideal target of $10500-10000. The market had different plans. Yes, I do not, and cannot, know all twists and turns beforehand because we are dealing with probabilities of possibilities and not with certainties. It bottomed last Friday, and since staged its best rally since Sept. 2. Thus a larger bounce is now under way to ideally $11505-11860. From there, I expect the next leg lower (red “c?”) to complete larger (black) wave-4. Wave-5 kicks should then rally the index back to new all-time highs and to complete the bull that started in 2009 in the spring of 2021. (See my recent article here explaining why.)
Bottom line. The current market environment remains the same as over the last few years: overextended rallies followed by fast-and-furious corrections. Thus, traders have to stay vigilant; resist the urge to chase, aka FOMO (Fear Of Missing Out); scale-out of longs, aka sell into strength; and raise their stops continuously to protect remaining profits. Besides, EWP and classic technical analyses (TA) need to be continually relied on for trading decisions. No technique or tool gets the right answer about the markets’ next move all the time. But EWP combined with TA is right often enough to allow for sound, safe and informed trading. My Premium Major Market Members are well-aware of these facts and use my forecasts wisely.
The NDX should now be in a larger bounce, which has likely not yet run its course as long as the index stays above Friday’s low.
Corrections (of corrections) are tricky and even more challenging to forecast than a five-wave impulse. Still, as long as the NDX stays below $12250, I expect the current counter-trend rally to fizzle out in the red target zone. After that, it should work its way lower into, preferably, the pink target zone ($10000-10500). But, as we have seen over the last few weeks, in Bull markets, “upside surprises and downside disappoints.” So, please do not be surprised if only the black target zone at $10250-10750 is reached for the larger wave-4.
Trading in financial instruments and/or cryptocurrencies involves high risks including the risk of losing some, or all, of your investment amount, and may not be suitable for all investors. Prices of cryptocurrencies are extremely volatile and may be affected by external factors such as financial, regulatory or political events. Trading on margin increases the financial risks.
Before deciding to trade in financial instrument or cryptocurrencies you should be fully informed of the risks and costs associated with trading the financial markets, carefully consider your investment objectives, level of experience, and risk appetite, and seek professional advice where needed.
Fusion Media would like to remind you that the data contained in this website is not necessarily real-time nor accurate. The data and prices on the website are not necessarily provided by any market or exchange, but may be provided by market makers, and so prices may not be accurate and may differ from the actual price at any given market, meaning prices are indicative and not appropriate for trading purposes. Fusion Media and any provider of the data contained in this website will not accept liability for any loss or damage as a result of your trading, or your reliance on the information contained within this website.
It is prohibited to use, store, reproduce, display, modify, transmit or distribute the data contained in this website without the explicit prior written permission of Fusion Media and/or the data provider. All intellectual property rights are reserved by the providers and/or the exchange providing the data contained in this website.
Fusion Media may be compensated by the advertisers that appear on the website, based on your interaction with the advertisements or advertisers.