Nasdaq 100 Update: Bounce Target Reached, Are Lower Lows Next?
Dr. Arnout ter Schure | Oct 01, 2020 02:21PM ET
In my update from early last week, I asked the question:
"Did [black] wave-4, therefore, already bottom? It is possible, but the failure of the index to reach the purple target zone suggests to me it may have one more twist and turn in place. This "twist and turn" would be red wave-b and -c, as shown in Figure 1. The former, a counter-trend rally, should ideally top around 11335-11755 before wave-c moves the index to the ideal (purple) target zone of 10000-10500. Once wave-b is confirmed, I can then further adjust the ideal wave-c target zone as I am still trying to look around 2-3 corners simultaneously, which leads to increased uncertainty."
Seven trading days later, and here we are, the Nasdaq 100 is trading at around 11560 today. Right in the target zone and a 4.4% gain since my last update (if you had used it to go long the index). The index could still move higher to the 61.80% or the 76.40% retrace levels, without any problem, but the daily RSI5 is already getting overbought, which is all that is required for a B-wave. Besides, my proprietary AI Buy/Sell indicator is not showing the strongest of follow-throughs yet, since it switched -correctly so- to a buy Sept. 22. It is one of my indicators my premium major market members get to enjoy and profit from.
Figure 1. NDX100 daily candlestick chart with EWP count.
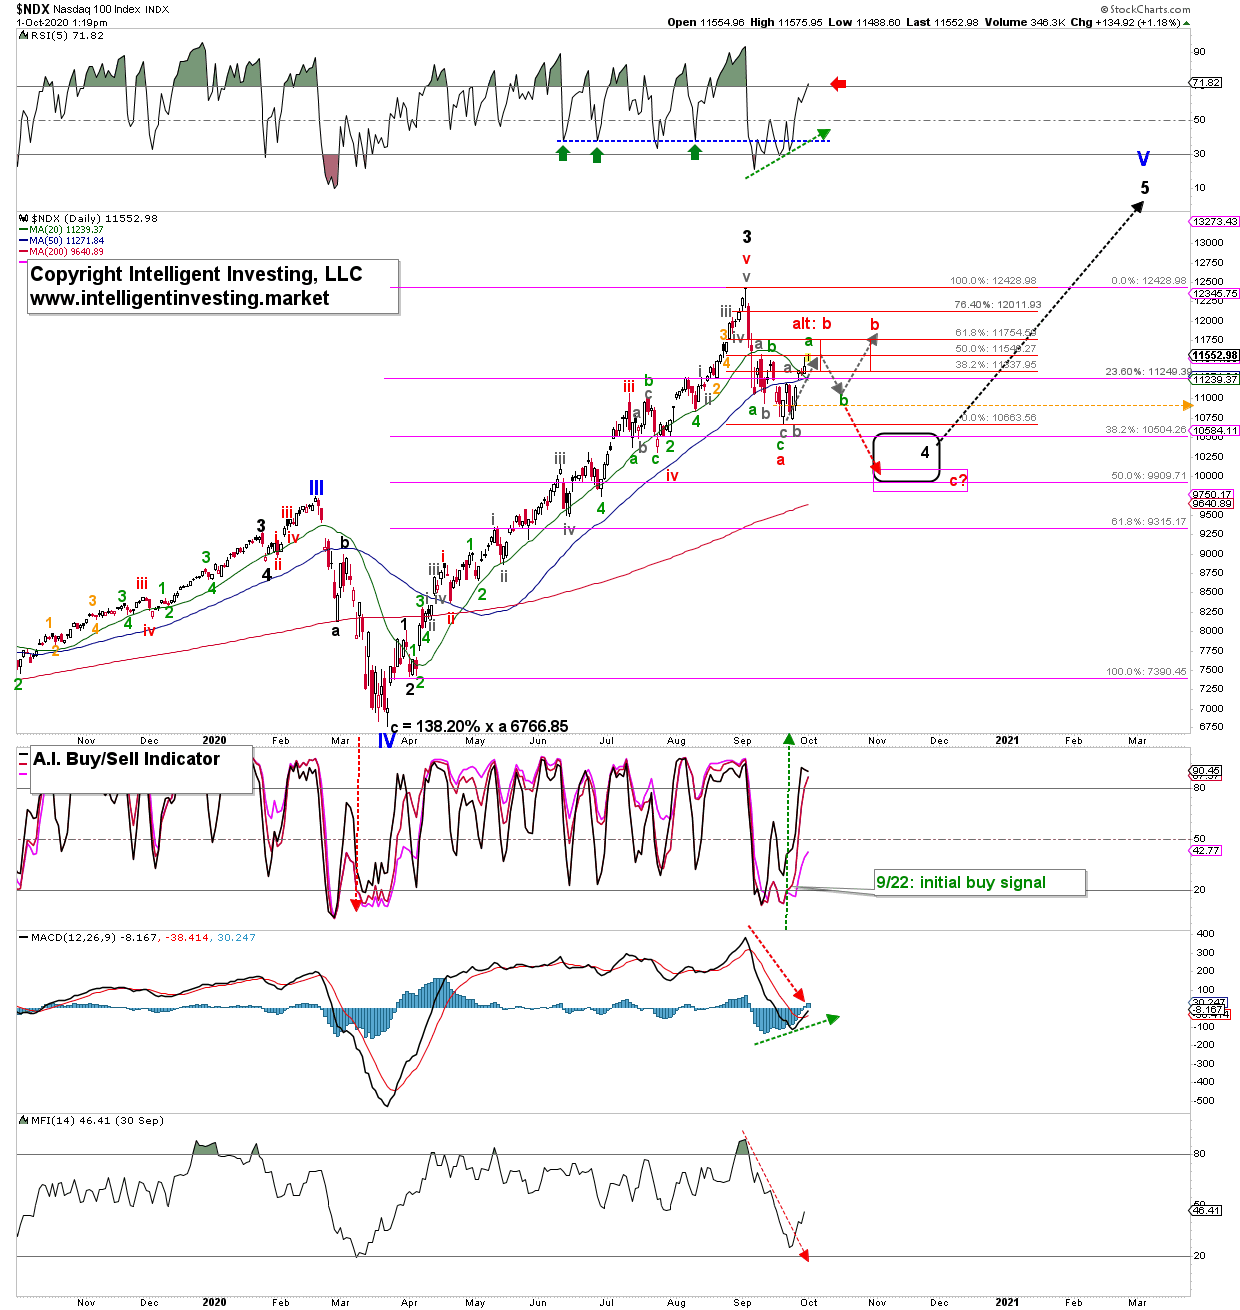
Thus, the question is if red wave-b is close to topping (alt: b), or if it has one more drop and pop in store (grey arrows). I cannot tell that with absolute certainty yet. Nobody can. But I can tell you the ideal bounce target zone from over a week ago has been reached; time to become more cautious, take profits, reduce long-side risk, etc. That is how my target zones can be used in your trading decisions. Luckily, we have the Elliott Wave Principle (EWP) on our side. As long as the next anticipated retrace (grey arrow for possible green wave-b) stays above the orange horizontal support level at 10900 on a closing basis, the grey path can still materialize.
The caution here is, as I've shared with you before, "the average annual U.S. election year pattern (see Figure 2 of my recent article about the S&P500: ). This pattern has a bottom by the third week of September, a counter-trend rally into late-September, and then a further decline into mid- to late-October." So far, so good. The index bottomed in the third week of September, and if all of wave-b is complete, then it is right on cue for the further decline as well.
Regardless, both the EWP count and this average U.S. election year pattern, expect near term downside. So, watch that 10900 level. It will be of great help to determine if the grey path or the red arrow will materialize. If the latter, I can now narrow down the ideal target red c-wave target zone further, compared to last week, to ideally 9750-10150.
Trading in financial instruments and/or cryptocurrencies involves high risks including the risk of losing some, or all, of your investment amount, and may not be suitable for all investors. Prices of cryptocurrencies are extremely volatile and may be affected by external factors such as financial, regulatory or political events. Trading on margin increases the financial risks.
Before deciding to trade in financial instrument or cryptocurrencies you should be fully informed of the risks and costs associated with trading the financial markets, carefully consider your investment objectives, level of experience, and risk appetite, and seek professional advice where needed.
Fusion Media would like to remind you that the data contained in this website is not necessarily real-time nor accurate. The data and prices on the website are not necessarily provided by any market or exchange, but may be provided by market makers, and so prices may not be accurate and may differ from the actual price at any given market, meaning prices are indicative and not appropriate for trading purposes. Fusion Media and any provider of the data contained in this website will not accept liability for any loss or damage as a result of your trading, or your reliance on the information contained within this website.
It is prohibited to use, store, reproduce, display, modify, transmit or distribute the data contained in this website without the explicit prior written permission of Fusion Media and/or the data provider. All intellectual property rights are reserved by the providers and/or the exchange providing the data contained in this website.
Fusion Media may be compensated by the advertisers that appear on the website, based on your interaction with the advertisements or advertisers.