Nasdaq 100 Triggers a New Volatility Correlation Sell Signal
Jesse Felder | May 31, 2023 03:45AM ET
A few years ago, I was studying the relationship between the major stock market indexes and their volatility indexes, and I came across and an intriguing phenomenon. The vast majority of the time, these indexes move in opposite directions from one another. If stock prices rise, volatility indexes usually fall and vice versa. It’s when this relationship inverts that things get interesting. And that’s exactly what happened again last week.
A new Nasdaq 100 Volatility Correlation sell signal was triggered last week when the 10-day correlation (the bottom panel in the chart below) of the NDX and CBOE NASDAQ 100 Volatility turned positive because both had risen together over that span. Previous sell signals are marked on the chart below by a vertical red line. Buy signals occur when the 10-day correlation turns positive because both the index and its volatility index are falling together. These are marked by vertical green lines in the chart.
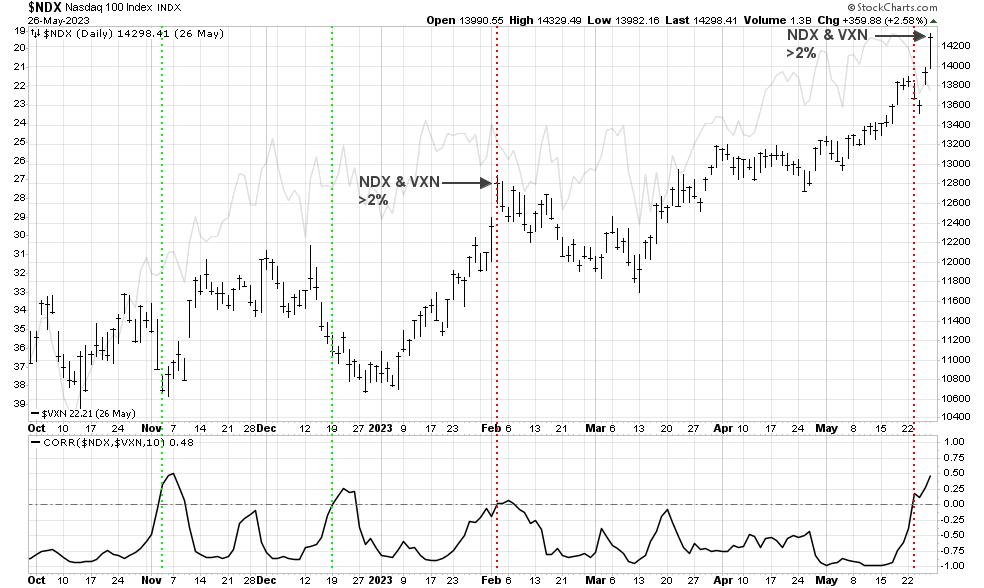
Why these signals are, at times, effective is anyone’s guess, but it’s clear that disconnects like this between equities and options markets can be important signals of impending trend reversals. The two previous buy signals late last year proved to be effective in that regard. The last sell signal in early February also proved effective as stocks struggled over the following month or so.
Time will tell if this most recent sell signal will also prove effective in this way. It’s interesting to note, however, that it also culminated in an even rare signal on Friday when both the NDX and VXN rose more than 2% on the day (last seen on 2/2). This is a pretty strong indication that the options market is not nearly as sanguine as the equities market at this stage of the rally. And that in itself may be an important development to pay attention to.
![]()
Trading in financial instruments and/or cryptocurrencies involves high risks including the risk of losing some, or all, of your investment amount, and may not be suitable for all investors. Prices of cryptocurrencies are extremely volatile and may be affected by external factors such as financial, regulatory or political events. Trading on margin increases the financial risks.
Before deciding to trade in financial instrument or cryptocurrencies you should be fully informed of the risks and costs associated with trading the financial markets, carefully consider your investment objectives, level of experience, and risk appetite, and seek professional advice where needed.
Fusion Media would like to remind you that the data contained in this website is not necessarily real-time nor accurate. The data and prices on the website are not necessarily provided by any market or exchange, but may be provided by market makers, and so prices may not be accurate and may differ from the actual price at any given market, meaning prices are indicative and not appropriate for trading purposes. Fusion Media and any provider of the data contained in this website will not accept liability for any loss or damage as a result of your trading, or your reliance on the information contained within this website.
It is prohibited to use, store, reproduce, display, modify, transmit or distribute the data contained in this website without the explicit prior written permission of Fusion Media and/or the data provider. All intellectual property rights are reserved by the providers and/or the exchange providing the data contained in this website.
Fusion Media may be compensated by the advertisers that appear on the website, based on your interaction with the advertisements or advertisers.