Nasdaq 100 Index Nears All-Time High but Remains Below Broken Trendline
Tim Knight | Jun 04, 2025 01:52AM ET
It’s been extraordinarily rough sailing for the rapidly diminishing equity bears on the planet since April 7th. In retrospect, the entire Trade War Bear Market lasted two days and one minute.
That is to say, it spanned Thursday, April 3, Friday, April 4, and for the first minute of Monday, April 7th. That was it. A grand total of thirteen hours and one minute of a bear market. Whoop-de-freakin’ do!
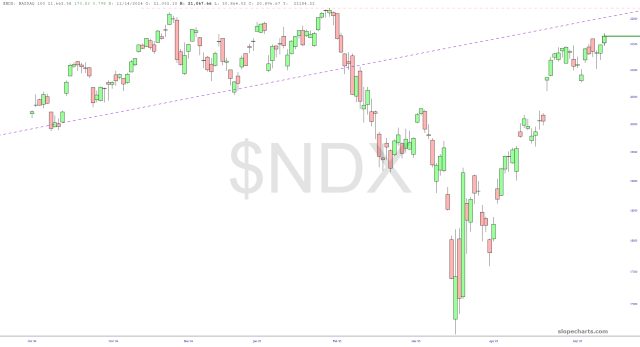
Having said that, let’s catch up with a handful of key markets. First up is the NASDAQ 100, which is getting within spitting distance of its lifetime high (set in February) but remains beneath its broken trendline.
A push above this broken trendline would be simultaneous with a lifetime high and would probably end all bearish ambitions for months to come.
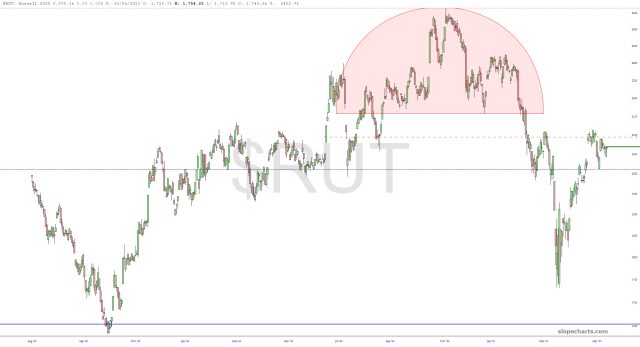
The small-cap Russell 2000 had a strong day today, but it still remains in a bearish setup. It is very close to its counter-trend peak, but the top (pink zone) remains intact.
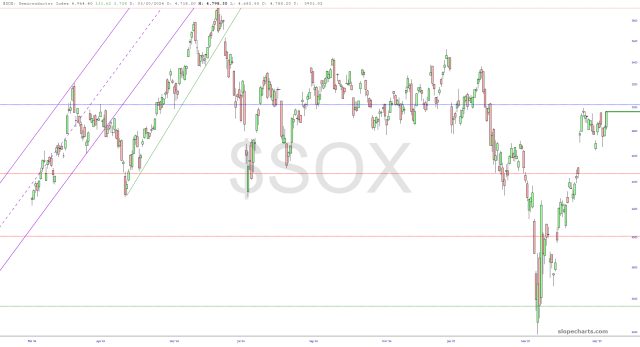
The semiconductor index is approaching Fibonacci resistance as well as a large zone of overhead supply. The aforementioned prospect for the $NDX (cutting above the broken trendline) would in all likelihood shove the Fib aside with little effort.
One market which is absolutely broken down and bearish is the Dow Transports. I again voice my regret that there is no good trading instrument for this, since the IYT ETF absolutely stinks. This chart is a wreck, and the price gap (to which the dashed line is anchored) is clear resistance short-term.
The Dow Utility Index is absolutely clinging to its own broken trendline. This would be an enticing trade, but the instrument to go about it, XLU, isn’t as compelling as the cash index (probably due to dividends).
As for volatility, it has collapsed by about 70% and may well crack below its trendline back into the mid-teens.
The precious metals gold mining index has been doing great, but its present price position relative to its pattern is looking quite lofty, and I’d say this rally is rather long in the tooth. Miners may have more upside, but even if they do, it isn’t going to be much, as long as this pattern remains respected.
Finally, although the oil producers index has been strong for weeks, the topping pattern here remains intact.
To be clear, recent strength has soured many of my bearish ambitions, particularly with respect to the broad themes of semiconductors and crude oil. I’m down but not out, as they say. My commitment level is at 102% spread across a relatively modest sixteen positions, but my stops are tight, and it’s going to take some real weakness to make me comfortable that the bears have the upper hand in this market again.
As it is now, the bulls seized the baton firmly on April 7th, and they haven’t managed to drop it since then.
Trading in financial instruments and/or cryptocurrencies involves high risks including the risk of losing some, or all, of your investment amount, and may not be suitable for all investors. Prices of cryptocurrencies are extremely volatile and may be affected by external factors such as financial, regulatory or political events. Trading on margin increases the financial risks.
Before deciding to trade in financial instrument or cryptocurrencies you should be fully informed of the risks and costs associated with trading the financial markets, carefully consider your investment objectives, level of experience, and risk appetite, and seek professional advice where needed.
Fusion Media would like to remind you that the data contained in this website is not necessarily real-time nor accurate. The data and prices on the website are not necessarily provided by any market or exchange, but may be provided by market makers, and so prices may not be accurate and may differ from the actual price at any given market, meaning prices are indicative and not appropriate for trading purposes. Fusion Media and any provider of the data contained in this website will not accept liability for any loss or damage as a result of your trading, or your reliance on the information contained within this website.
It is prohibited to use, store, reproduce, display, modify, transmit or distribute the data contained in this website without the explicit prior written permission of Fusion Media and/or the data provider. All intellectual property rights are reserved by the providers and/or the exchange providing the data contained in this website.
Fusion Media may be compensated by the advertisers that appear on the website, based on your interaction with the advertisements or advertisers.