Gold Bulls Don't Want This Indicator To Peak Here
Chris Kimble | Jun 26, 2019 02:10PM ET
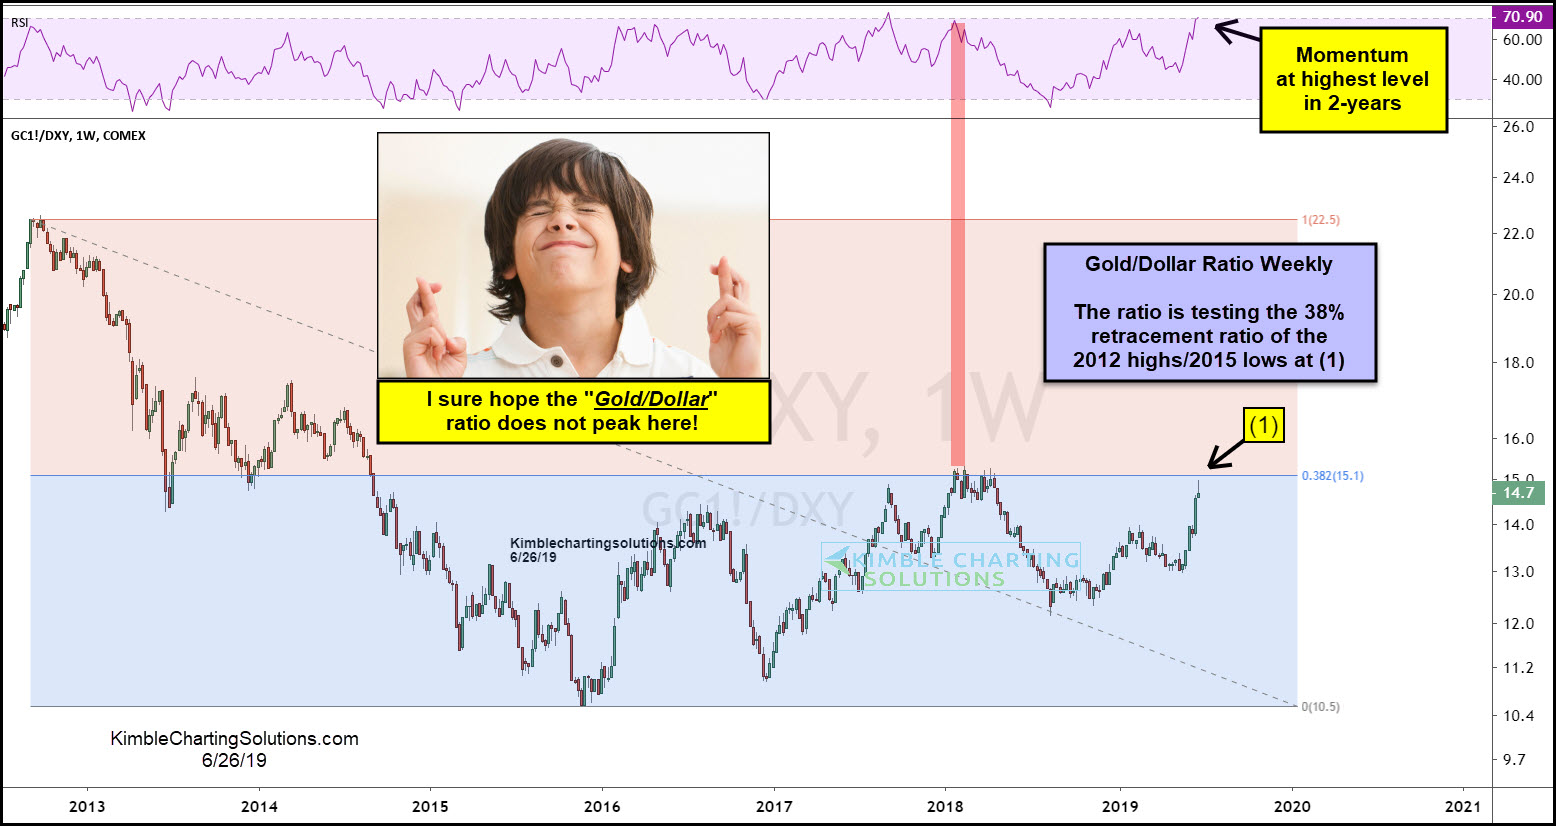
Gold has been strong as the U.S. dollar has been weak. This combo has driven the Gold:Dollar ratio to a key price zone and momentum level that looks to be important to metals bulls.
This chart looks at the Gold:Dollar ratio over the past 6 years. The long-term trend is down, while the trend over the past 3 years is pretty much flat (sideways trading range).
The recent rally has the ratio testing the 2018 highs as well as its 38% Fibonacci retracement level of the 2012 highs/2015 lows at (1).
While testing these key levels at (1), momentum is the highest since the 2017 highs. The bullish case for metals is facing an important breakout/resistance test at (1).
One thing is for sure, metals bulls have their fingers crossed that a lower high peak does not take place at current levels.
If the ratio breaks above resistance at (1), it will send a bullish message to metals that they haven’t seen in years.
![]()
Trading in financial instruments and/or cryptocurrencies involves high risks including the risk of losing some, or all, of your investment amount, and may not be suitable for all investors. Prices of cryptocurrencies are extremely volatile and may be affected by external factors such as financial, regulatory or political events. Trading on margin increases the financial risks.
Before deciding to trade in financial instrument or cryptocurrencies you should be fully informed of the risks and costs associated with trading the financial markets, carefully consider your investment objectives, level of experience, and risk appetite, and seek professional advice where needed.
Fusion Media would like to remind you that the data contained in this website is not necessarily real-time nor accurate. The data and prices on the website are not necessarily provided by any market or exchange, but may be provided by market makers, and so prices may not be accurate and may differ from the actual price at any given market, meaning prices are indicative and not appropriate for trading purposes. Fusion Media and any provider of the data contained in this website will not accept liability for any loss or damage as a result of your trading, or your reliance on the information contained within this website.
It is prohibited to use, store, reproduce, display, modify, transmit or distribute the data contained in this website without the explicit prior written permission of Fusion Media and/or the data provider. All intellectual property rights are reserved by the providers and/or the exchange providing the data contained in this website.
Fusion Media may be compensated by the advertisers that appear on the website, based on your interaction with the advertisements or advertisers.