May 2020 Yield Curve Update
Kevin Erdmann | Jun 09, 2020 12:41AM ET
The yield curve (using Eurodollar Futures) has undergone a series of shifts with the coronavirus pandemic. In the first graph, we can see that starting from the end of January, the whole curve shifted down by early March. It shifted down more by March 10, as the extent of the pandemic became worse. Then, it steepened over the next week as, across the US, cities, states, and citizens took action.
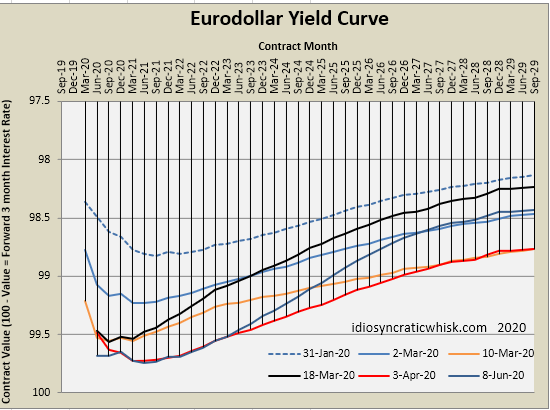
Then it shifted down again in late March as the pandemic worsened in the early weeks of the lockdown. Then it steepened again over the course of April and May.
The result of these shifts is that short term rates are much lower than they were at the beginning of March but long term rates are about the same as they were.
I would say that we have encountered a pretty hairy real economic shock, but the Fed has done a decent job of countering that shock so that the nominal shock is lower than it could be. (Five year inflation is still under 1% , so there is room for more, but obviously the Fed has been very active.)
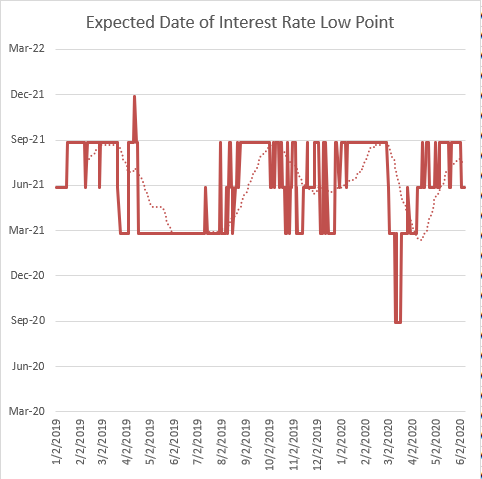
The second chart here is an estimate of the first month when short term rates are expected to rise. Before the pandemic, rates were not expected to bottom until September 2021, and that date was potentially moving out in time, just like it did after the GFC when the Fed would prematurely stop doing quantitative easing.
That was the main danger of the pre-COVID economy, that the Fed was pulling back on nominal growth just a little too much. That, by itself, is unlikely to cause a crisis or an intense contraction, but it does put the economy in more danger of running into problems, especially, as the past 3 months have made clear, we never know what's around the corner.
The shock we did get was strong enough to kick the Fed into recovery mode, so I think the stock market has basically reacted to an exchange of risks. We got a real shock, but now we are less likely to have whatever low-level monetary stagnation we were going to get otherwise. If the expected future date of the first-rate increase continues to push back to us in time (it's now at June 2021), then that might be evidence that the Fed has mitigated some of the real shock by moving into recovery mode. Basically, this would create a deeper but shorter recession.
The next graph is my modified inversion measure. Any spot below the trendlines is effectively yield-curve inversion. We are still technically inverted, but now the Fed has so many programs in place to provide liquidity there might be hope for recovery even if long-term yields remain low. Understanding that is above my pay grade. In either case, if 10-Year yields can rise above, say, 1.5%, that would definitely be bullish. Even more so if the Fed misinterprets buoyant yields as some sort of headwind that calls for more stimulus.
In the meantime, it's a trader's market. There are a lot of stocks still well below their previous highs and many stocks at all-time highs. Their relative outcomes will depend on real developments. A lot of people are talking about where the "stock market" is, but now really is a time where prices on individual stocks can present opportunities for acting on particular knowledge or simply for having the guts to take on potentially embarrassing positions that, nonetheless, have potential.
Trading in financial instruments and/or cryptocurrencies involves high risks including the risk of losing some, or all, of your investment amount, and may not be suitable for all investors. Prices of cryptocurrencies are extremely volatile and may be affected by external factors such as financial, regulatory or political events. Trading on margin increases the financial risks.
Before deciding to trade in financial instrument or cryptocurrencies you should be fully informed of the risks and costs associated with trading the financial markets, carefully consider your investment objectives, level of experience, and risk appetite, and seek professional advice where needed.
Fusion Media would like to remind you that the data contained in this website is not necessarily real-time nor accurate. The data and prices on the website are not necessarily provided by any market or exchange, but may be provided by market makers, and so prices may not be accurate and may differ from the actual price at any given market, meaning prices are indicative and not appropriate for trading purposes. Fusion Media and any provider of the data contained in this website will not accept liability for any loss or damage as a result of your trading, or your reliance on the information contained within this website.
It is prohibited to use, store, reproduce, display, modify, transmit or distribute the data contained in this website without the explicit prior written permission of Fusion Media and/or the data provider. All intellectual property rights are reserved by the providers and/or the exchange providing the data contained in this website.
Fusion Media may be compensated by the advertisers that appear on the website, based on your interaction with the advertisements or advertisers.