Math Behind Last Weeks Crash: Part 2
Chris Vermeulen | Feb 13, 2018 01:11AM ET
Yesterday we shared with you Math Behind Last Weeks Crash: Part 1. Today, we want to show you the what the math is pointing to in the short term and what to expect next.
For this type of analysis, we are going to use the Adaptive Dynamic Learning (ADL) modeling system that attempts to tear apart price and technical data from within a chart and reconstruct future price data by learning from the past. In these examples, we will focus on Weekly and Monthly data going forward about 25 periods. The intent is to clearly illustrate how our earlier analysis (completed near the end of December 2017) is still aligning with our current analysis. Amazing how these things all plug together like a big puzzle when you think about it.
Remember, in late December 2017, we predicted a massive rally to start 2018 that would peak near the end of January or early February with a downside price rotation before stalling near the February 20. At that time, we predicted that a new rally would start and would likely peak near or after March 15.
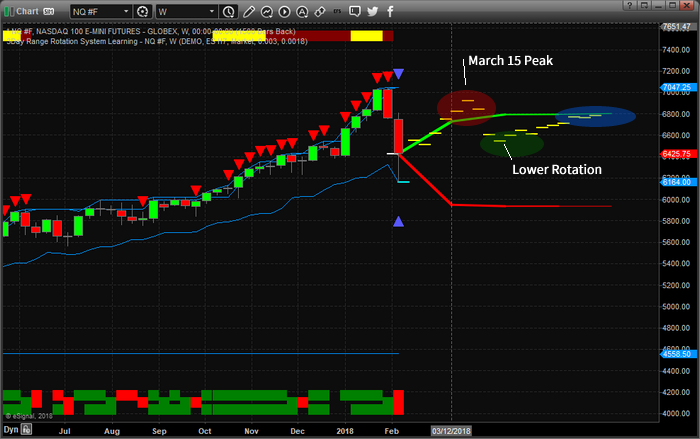
Take a look at this Weekly NQ ADL chart and tell me what you think of our analysis and predictive modeling systems after understanding how accurate this type of work can be. Yes, nearly two months ago, we predicted this move and our current analysis (as of February 9, 2018) is providing this current prediction.
Based on Weekly data
- The NQ price should stall and rotate about 100~200 pts higher over the next 2~3 weeks
- Near March 1, the NQ price should begin another rally that will likely peak near March 15 (+400 pts)
- After that March 15 peak, the price should fall to near 6600 (-400 pts) before finding support and stalling.
- Moderate upside price activity will likely follow with more narrow price volatility.
So, are you starting to get a picture of what to expect in the future? Of course, any outside news event (war, catastrophe or other global conflict) could dramatically alter the outcome of price action in the future and our system can’t predict for these types of events. But given historical price action and technical data, this is the most likely outcome (based on 54 unique instances of related data over 10 years of history showing the likelihood of this data being almost 97% accurate).
At this point, we are going to reiterate our earlier call of a very QUICK and TIGHT “Flag” or “Pennant” formation in prices over the next few weeks that will result in support likely being found near $6500~6600 in the NQ before another attempt at higher prices is launched. Remember, we are predicting a future where a new rally may start near or after February 20 and a peak in prices should be reach near or after March 15.
This image of the Monthly ADL system is showing, very clearly, that prices will likely rotate within the current price range while establishing a technical pattern for further advancement. We believe our analysis from late December 2017 is still very valid and accurate. We believe this new FLAG formation is a result of the price correction we expected from our earlier analysis, yet we could not predict the severity of the move at that time. We did know that NQ prices had already exceeded our predicted boundaries and because of that we felt that prices were going to contract in a moderately aggressive manner – we even warned our members of this potential.
As of right now, we expect the markets to open next week with moderate price volatility in a pattern that will result in a very quick and tight market FLAG formation. By the time February 20 hits, we believe the US Majors will begin advancing higher towards a March 15th peak.
We’ve included an “Insert Larger Perspective” which is a zoomed in capture of our ADL analysis to help you understand what we are seeing in the markets.
Remember, opportunities exist every week for traders and investors to take advantage of market rotation and key market moves. This is much like our gold miners sell-off prediction report showing the big opportunity using DUST etf.
Trading in financial instruments and/or cryptocurrencies involves high risks including the risk of losing some, or all, of your investment amount, and may not be suitable for all investors. Prices of cryptocurrencies are extremely volatile and may be affected by external factors such as financial, regulatory or political events. Trading on margin increases the financial risks.
Before deciding to trade in financial instrument or cryptocurrencies you should be fully informed of the risks and costs associated with trading the financial markets, carefully consider your investment objectives, level of experience, and risk appetite, and seek professional advice where needed.
Fusion Media would like to remind you that the data contained in this website is not necessarily real-time nor accurate. The data and prices on the website are not necessarily provided by any market or exchange, but may be provided by market makers, and so prices may not be accurate and may differ from the actual price at any given market, meaning prices are indicative and not appropriate for trading purposes. Fusion Media and any provider of the data contained in this website will not accept liability for any loss or damage as a result of your trading, or your reliance on the information contained within this website.
It is prohibited to use, store, reproduce, display, modify, transmit or distribute the data contained in this website without the explicit prior written permission of Fusion Media and/or the data provider. All intellectual property rights are reserved by the providers and/or the exchange providing the data contained in this website.
Fusion Media may be compensated by the advertisers that appear on the website, based on your interaction with the advertisements or advertisers.