Math Behind Last Weeks Crash: Part 1
Chris Vermeulen | Feb 12, 2018 01:22AM ET
After surviving one of the biggest market rotations in the last 3+ years, we have been getting quite a bit of request for a detailed analysis of this move and asked what our specialized modeling systems are telling us is likely to happen. Our research team at Technical Traders Ltd. has put together this short reference of “the math behind the move” that will show you what is happening and the underlying price mechanics that are going to be driving prices in the future.
Now, before we get into the details of the mathematics of this recent rotation, we want to preface the fact that our current analysis indicates that the Tuesday low appears to be the ultimate low at this time and that future price activity will either confirm this or create an alternate price outcome. As we are going through the mechanics of this move, remember that we predicted a massive price advance for the beginning of 2018 that would result in a “relief pullback” near the end of January before finding new support and launching into an additional advance culminating in a price peak near March 15 (this was the furthest future point that our predictive modeling systems could identify at that time in December 2017). As of right now, our analysis was DEAD ON.
So, what do our predictive modeling systems tell us now and what should you be doing as investors/traders? Let’s get into the details – shall we?
This monthly chart of the NQ provides a pretty clear picture of the current Elliot Wave formations and presents a clear understanding that we are currently in a WAVE 5 expansion of a broader WAVE 3 move to the upside. These WAVE 5’s can be somewhat extensive and are often equal to or greater than the previous WAVE 3 move. Thus, we have just recently reached the EQUAL price range in the current WAVE 5 compared to the previous WAVE 3. This means we should be expecting a bit of rotation and consolidation near these levels before price determines if this WAVE 5 move will continue.
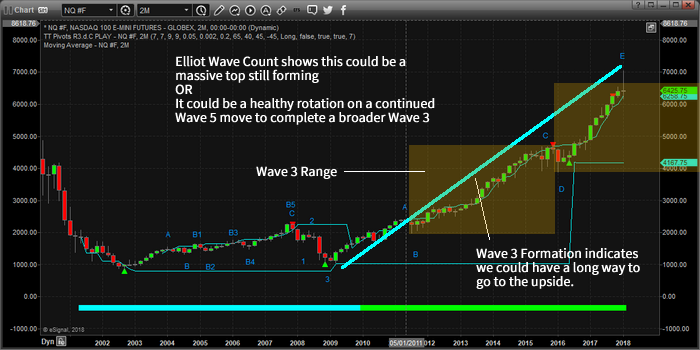
Given this mathematical and technical data as well as knowing that this current WAVE 5 could have further upside potential, we need to understand the potential for a deeper downside price retracement and understand the more micro modeling results.
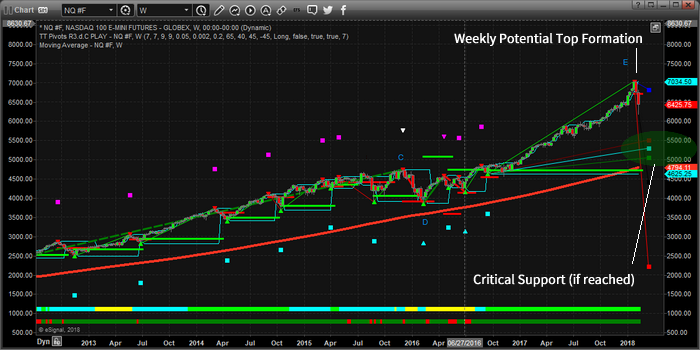
This next Weekly chart is using our Fibonacci/Elliot Wave modeling system that assists us in determining critical price levels and turning points. As or right now, on the hard right edge of this chart, we are seeing that the current price is warning of a moderately deep retracement that is setting up as long as the price stays below $6720. Additionally, it is showing very strong support near the $5000~5500 level. This modeling system tells us that if recent lows are breached, the change that prices would fall to near $5500 is fairly strong.
Again, remember that we are “potentially” nearing the end of WAVE 5. We don’t have any real confirmation of this move yet, and all we can do is be aware that WAVE 5 if this is the end, will create a short-term corrective wave (Intermediate Wave 4: down) that will end with the creation of a massive broader WAVE 5 higher. So, at this point, we have a healthy rotation that may turn into a WAVE 5 top.
Now that we’ve completed the MACRO analysis, we have to understand what the MICRO analysis and modeling systems are telling us. Remember, these two charts are Monthly and Weekly modeling systems that are showing us the very long term price potential (over many weeks, months or years). For a more immediate analysis of what we should expect over the next few days, we have to use other modeling systems which paint a very clear and exciting picture for us as traders. Tomorrow we will post PART 2 of this report showing you exactly where the markets are headed over the four weeks.
Trading in financial instruments and/or cryptocurrencies involves high risks including the risk of losing some, or all, of your investment amount, and may not be suitable for all investors. Prices of cryptocurrencies are extremely volatile and may be affected by external factors such as financial, regulatory or political events. Trading on margin increases the financial risks.
Before deciding to trade in financial instrument or cryptocurrencies you should be fully informed of the risks and costs associated with trading the financial markets, carefully consider your investment objectives, level of experience, and risk appetite, and seek professional advice where needed.
Fusion Media would like to remind you that the data contained in this website is not necessarily real-time nor accurate. The data and prices on the website are not necessarily provided by any market or exchange, but may be provided by market makers, and so prices may not be accurate and may differ from the actual price at any given market, meaning prices are indicative and not appropriate for trading purposes. Fusion Media and any provider of the data contained in this website will not accept liability for any loss or damage as a result of your trading, or your reliance on the information contained within this website.
It is prohibited to use, store, reproduce, display, modify, transmit or distribute the data contained in this website without the explicit prior written permission of Fusion Media and/or the data provider. All intellectual property rights are reserved by the providers and/or the exchange providing the data contained in this website.
Fusion Media may be compensated by the advertisers that appear on the website, based on your interaction with the advertisements or advertisers.