Massive Price Reversion May Be Days Or Weeks Away
Chris Vermeulen | Sep 22, 2019 05:07AM ET
Our researcher team believes a massive global market price reversion/correction may be setting up and may only be a few days or weeks away from initiating. Our team of dedicated researchers and market analysts have been studying the markets, precious metals, and most recently the topping formation in the ES (S&P 500 Index). We believe the current price pattern formation is leading into a price correction/reversion event that could push the US major indexed lower by at least 12 to 15%.
Historically, these types of price reversion events are typically considered “price exploration”. Over time, investors push a pricing/valuation bias into the markets because of expectations and perceptions related to future market valuations and outcomes. What happens when these current valuation levels and future expectations shift perspective from optimistic to potentially overvalued is that a price reversion event takes place. This happens when investors shift focus, determine value exists at a different price level and abandon previous valuation expectations.
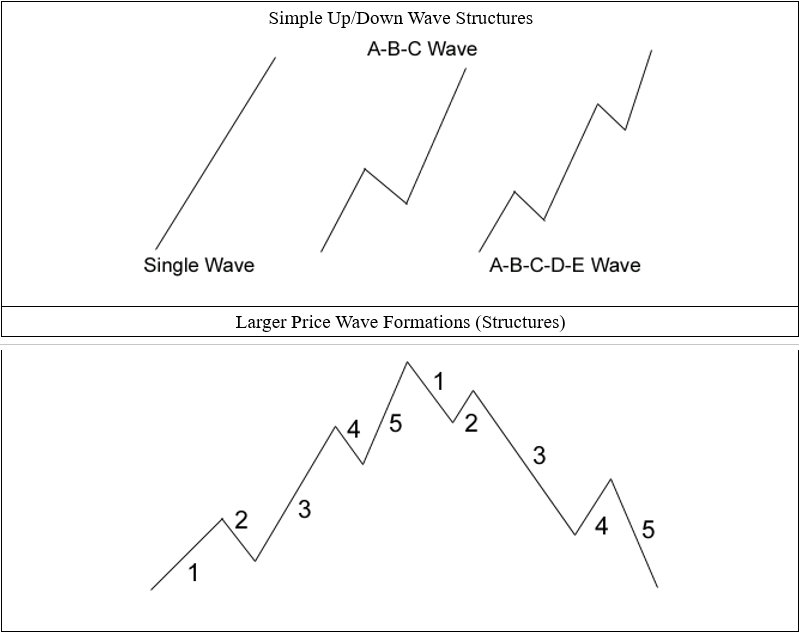
The rotation in price is actually a very healthy process that must take place from time to time. The structure of price waves (for example Elliot Wave, Fibonacci, Japanese Candlestick, Gann and other price theories) are based on this process of price rising to overbought levels, then retracing to oversold levels – again and again as price trends higher or lower. This is the process of “price exploration” – just as we are describing. In order for price to trend higher or lower over time, price must move in the wave like pattern to identify true value (retracement/reversion) and extended value (a rally or selloff) in a type of wave formation.
Here are examples of the typical price wave formations within an extended or intermediate-term price trend.

These price formations/structure are inherent in all price activity/movement in every financial instrument traded throughout the world. They are the underlying structural foundation of all price activity and the basis of Elliot Wave, Fibonacci, Japanese Candlestick and many other price theories.

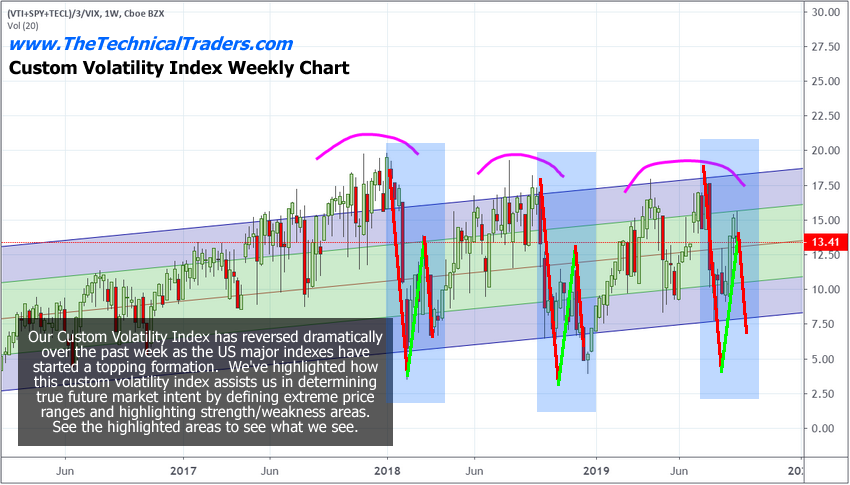
Weekly Custom Volatility index
Our Custom Volatility index is highlighting a very interesting pattern/setup currently that suggests a moderate price reversion may take place over the next few days/weeks. We’ve highlighted these patterns on the chart below illustrating how our Custom Volatility index helps to identify these types of patterns. They form after a moderately deep price decline, the first downside (RED) line shown in these examples, and are followed by a moderate price recovery. Then, a deeper price decline sets up only 3 to 5 weeks after the initial price bottom resulting in what can sometimes be a very broad market decline.For example, the decline in February 2018 resulted in a very moderate second price decline compared to the initial selloff. The October 2018 price decline resulted in a similar pattern on our Custom Volatility index, but the second price decline was much deeper and more violent than the example in February 2018. This is the type of price correction that we are expecting to see happen within the next 2 to 4 weeks.The current price rotation on our Custom Volatility index mirrors the previous rotations almost perfectly and the new breakdown event should only be 3 to 10+ days away from starting. The big question is “will this be a moderate price reversion event or a more violent price reversion event like we saw in November/December 2018?”
Weekly Custom Smart Cash Index
Our Custom Smart Cash Index is suggesting weakness is dominating the global markets right now. We would expect to see our Smart Cash index rise as investor expectations rally and as global stock markets rally. Yet, this index has been steadily moving lower as weakness dominates investor sentiment. We believe we may begin a new price reversion event (a price breakdown) on some news event or economic that could push the global stock market dramatically lower – possibly my 12%+ or more. Our earlier, August 19th breakdown predictions, suggested a downside breakdown could result in a 16% to 24% market correction – these levels are still very valid.
Weekly Dow Jones Index
The Dow Jones Index is setting up a DUAL-FLAG (pennant) formation that has kept our researchers entranced over the past few months. This very broad market patter strongly suggests a very violent and explosive price move is just days or weeks away. We’ve highlighted the “Flag Apex Range” on this chart to show you where and when we expect this explosive move to begin. Investors need to be very aware that these flag/pennant formations are extremely close to reaching the breakout/breakdown APEX and all of our other research tools are suggesting a move lower is the highest probability outcome given the current markets setup.
Concluding Thoughts:
As we’ve stated earlier, the global markets are very much “waiting on news events”. It appears fundamentals and earnings are driving only 30~40% of the market movement recently. NEWS is driving 60% to 70% of the global markets price rotation. Geopolitical news, commodity supply news, war or any other aggression news is also very important in today’s world. Pay attention to the news items that hit the markets as the global central banks attempt to navigate the undulating global market environment.
Our advice for skilled technical traders would be to protect everything from risks and prepare for some very extreme volatility over the next 3 to 15+ days. We believe the APEX even is about to happen and it could become a massive price reversion event.
Trading in financial instruments and/or cryptocurrencies involves high risks including the risk of losing some, or all, of your investment amount, and may not be suitable for all investors. Prices of cryptocurrencies are extremely volatile and may be affected by external factors such as financial, regulatory or political events. Trading on margin increases the financial risks.
Before deciding to trade in financial instrument or cryptocurrencies you should be fully informed of the risks and costs associated with trading the financial markets, carefully consider your investment objectives, level of experience, and risk appetite, and seek professional advice where needed.
Fusion Media would like to remind you that the data contained in this website is not necessarily real-time nor accurate. The data and prices on the website are not necessarily provided by any market or exchange, but may be provided by market makers, and so prices may not be accurate and may differ from the actual price at any given market, meaning prices are indicative and not appropriate for trading purposes. Fusion Media and any provider of the data contained in this website will not accept liability for any loss or damage as a result of your trading, or your reliance on the information contained within this website.
It is prohibited to use, store, reproduce, display, modify, transmit or distribute the data contained in this website without the explicit prior written permission of Fusion Media and/or the data provider. All intellectual property rights are reserved by the providers and/or the exchange providing the data contained in this website.
Fusion Media may be compensated by the advertisers that appear on the website, based on your interaction with the advertisements or advertisers.