Massive Momentum Structure In Stock Market Is Breaking Down
Jesse Felder | Sep 01, 2022 04:30AM ET
A little over a year ago, I had the pleasure of interviewing massive momentum structure ” that had been building for years in the stock market, specifically in the Nasdaq 100.
Below is an updated version of that chart which plots the index on a monthly timeframe along with another plot of the index relative to its 36-month moving average. It is this second chart, which isolates the price momentum of the index, that has formed a long-term structure of some significance.
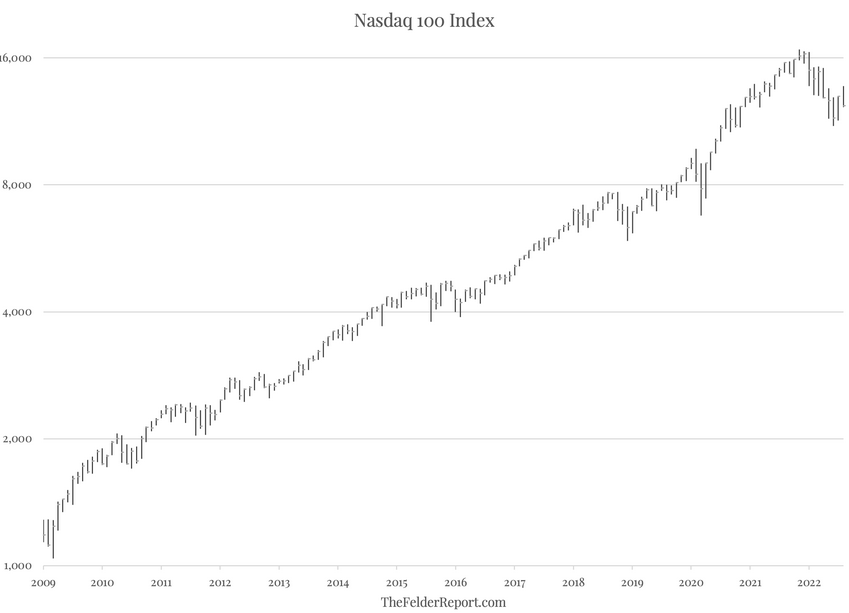
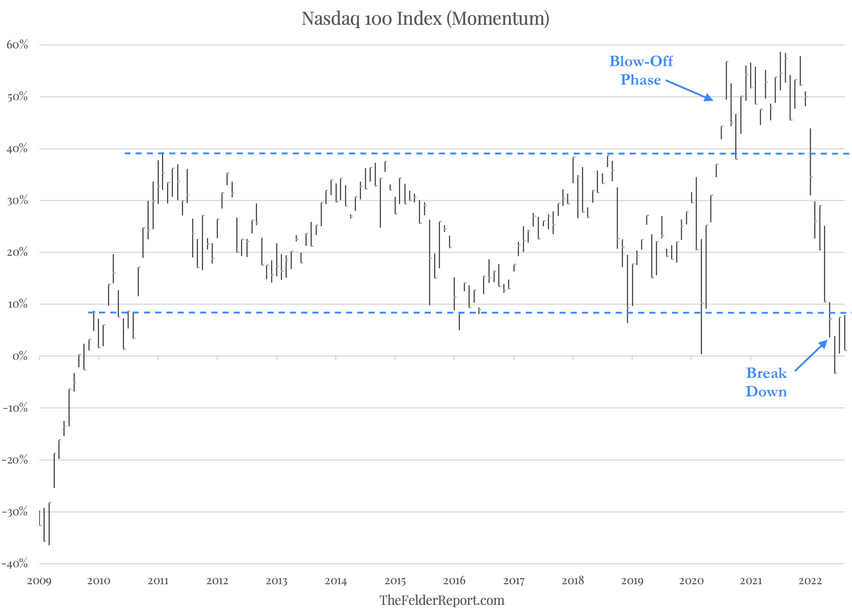
During the bull market that dated back to the 2009 low, the Nasdaq 100 Index formed a clear momentum range between roughly 40% (above the 36-month moving average) on the high side and 10% on the low side. The post-Covid rally saw a breakout above the upper end of that range, which represents the final “blow-off phase” of the bull market.
This year’s reversal is notable in that not only did momentum fail to hold support at the 10% level for the first time in over a decade, it also failed to hold the 0% level, a “declarative first leg of decline,” in Michael’s words. And even to the untrained eye, it should be quite obvious that a major change in character is now underway.
Trading in financial instruments and/or cryptocurrencies involves high risks including the risk of losing some, or all, of your investment amount, and may not be suitable for all investors. Prices of cryptocurrencies are extremely volatile and may be affected by external factors such as financial, regulatory or political events. Trading on margin increases the financial risks.
Before deciding to trade in financial instrument or cryptocurrencies you should be fully informed of the risks and costs associated with trading the financial markets, carefully consider your investment objectives, level of experience, and risk appetite, and seek professional advice where needed.
Fusion Media would like to remind you that the data contained in this website is not necessarily real-time nor accurate. The data and prices on the website are not necessarily provided by any market or exchange, but may be provided by market makers, and so prices may not be accurate and may differ from the actual price at any given market, meaning prices are indicative and not appropriate for trading purposes. Fusion Media and any provider of the data contained in this website will not accept liability for any loss or damage as a result of your trading, or your reliance on the information contained within this website.
It is prohibited to use, store, reproduce, display, modify, transmit or distribute the data contained in this website without the explicit prior written permission of Fusion Media and/or the data provider. All intellectual property rights are reserved by the providers and/or the exchange providing the data contained in this website.
Fusion Media may be compensated by the advertisers that appear on the website, based on your interaction with the advertisements or advertisers.