Market Indices Sentiment With The Rising 50 EMA
Kay Kim | Mar 20, 2016 11:53AM ET
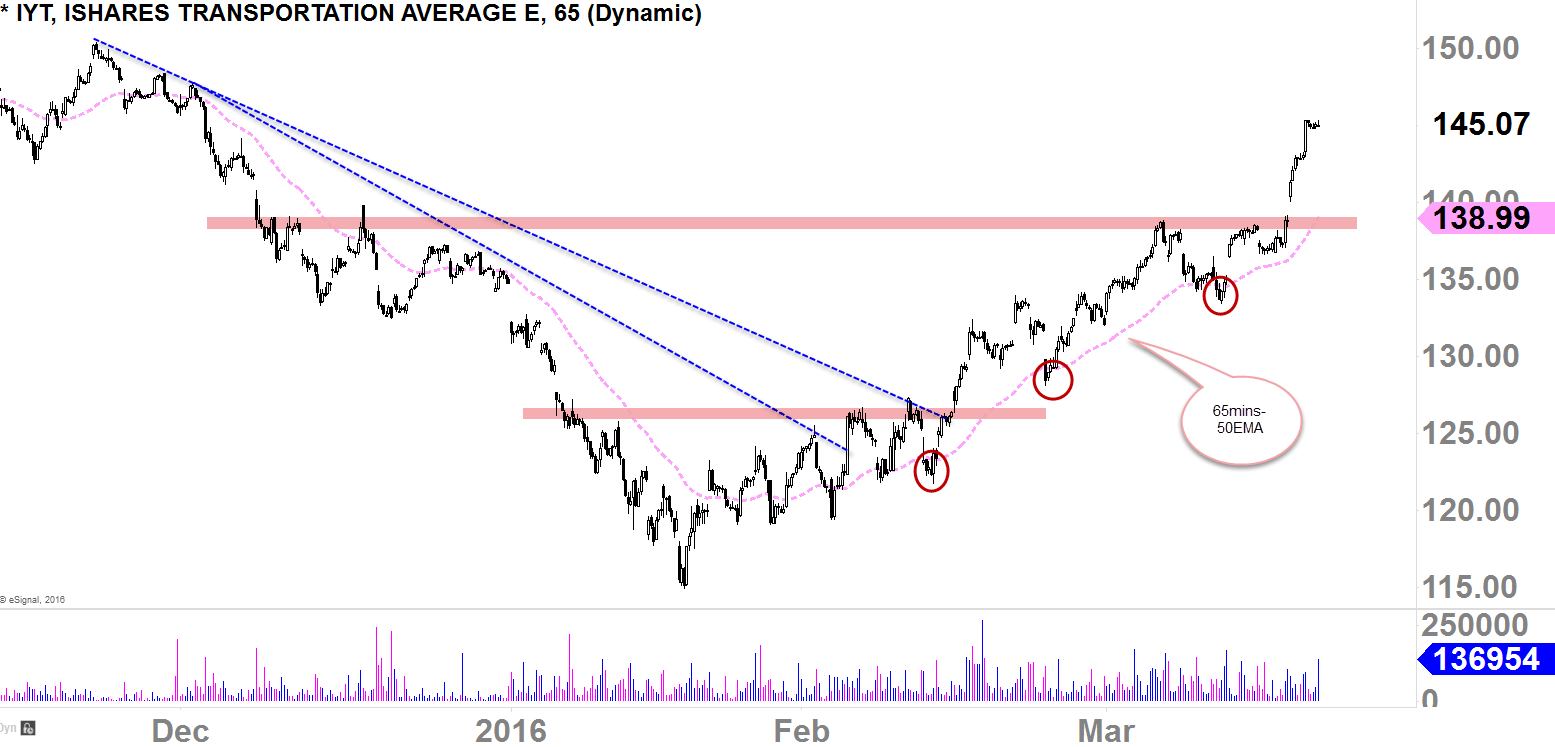
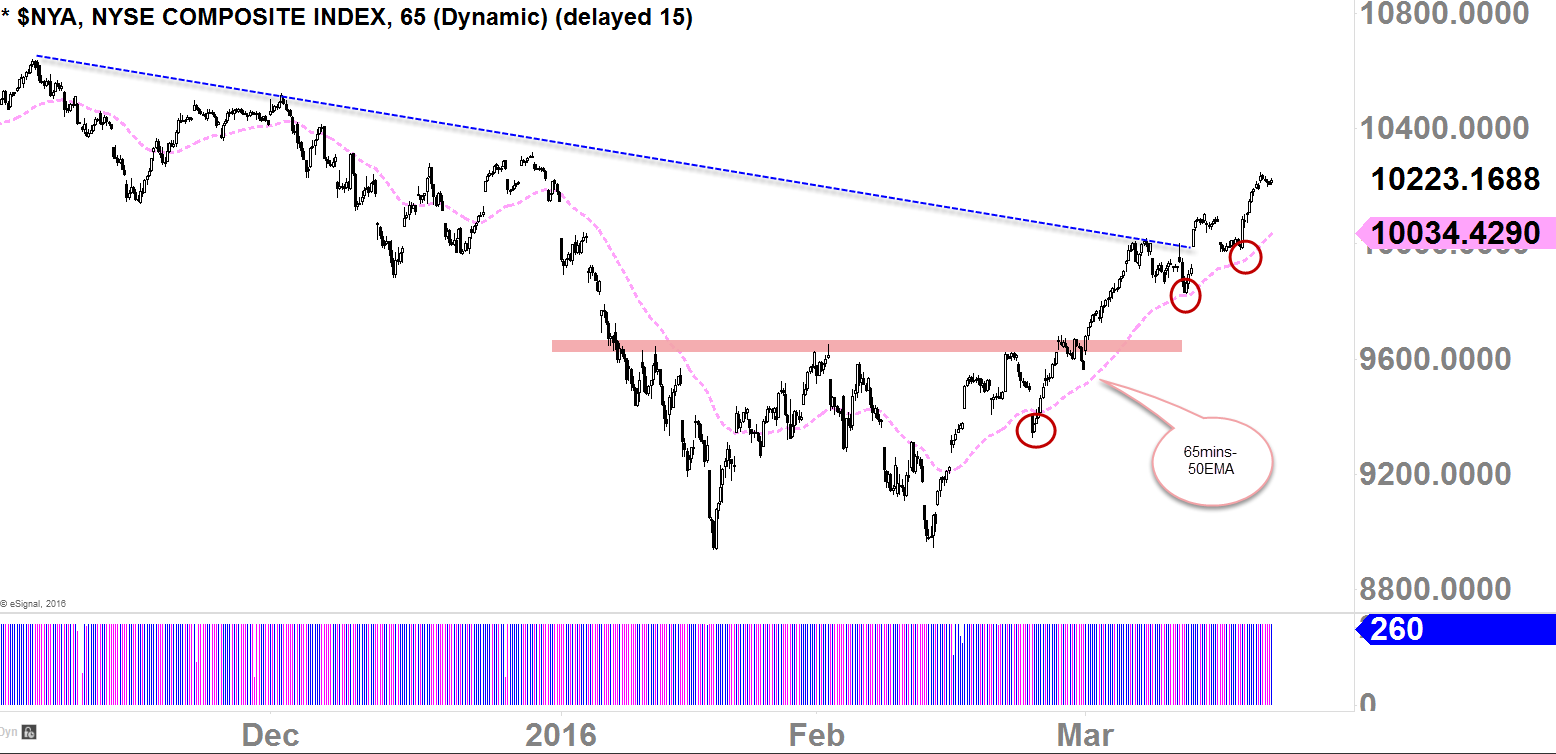
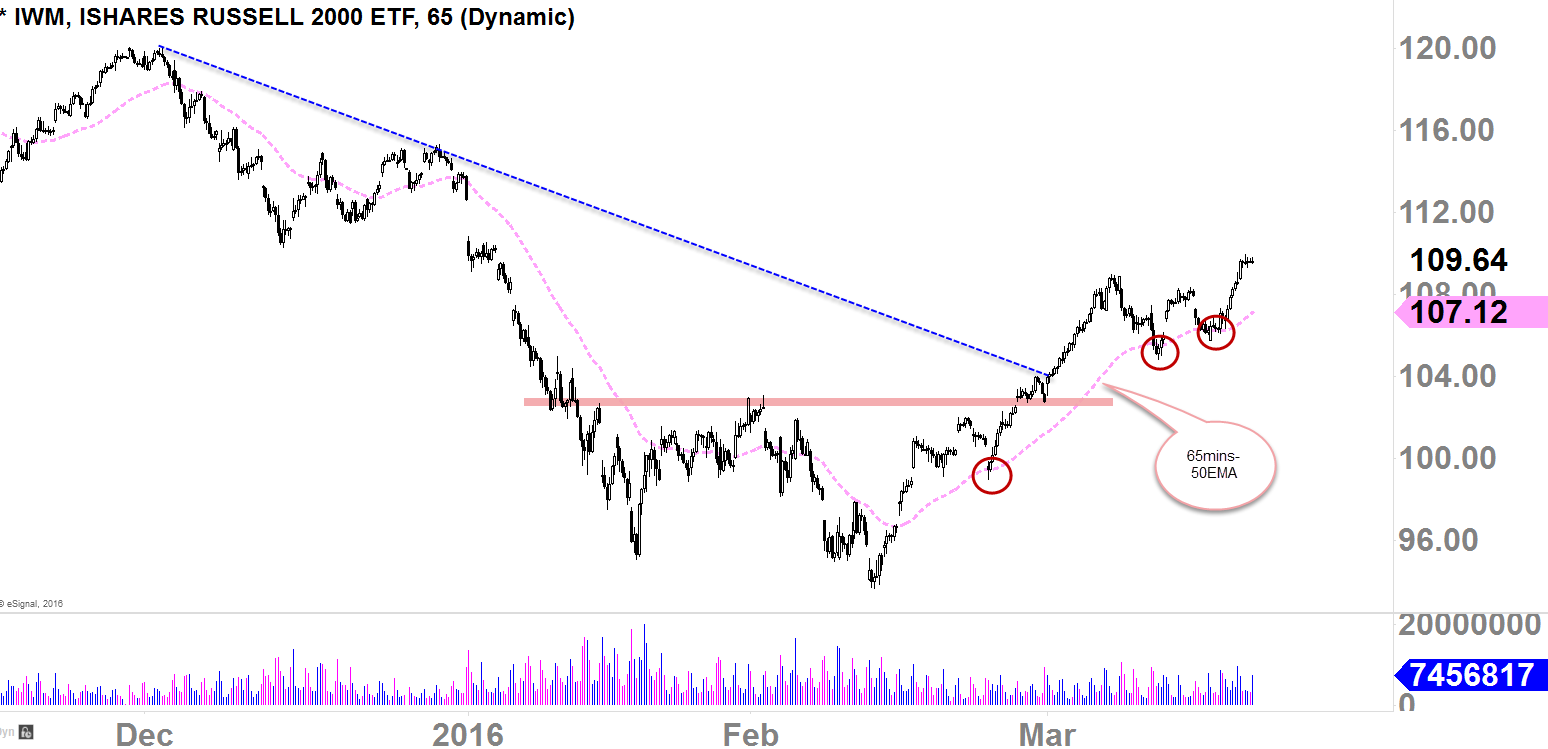
In this post I would like to share several charts of the market indices; they are 65-min charts with 50EMA (Exponential Moving Average) planted on them. I think these charts will be helpful as we start to gauge the market in the coming weeks. The market will have its ups and downs, so these charts could be used as a guidance to understand the market's perspective and its sentiment. Following the 65-min chart 50EMA might especially be a good tool to follow to gauge the health of the intermediate-term trend.
iShares Transportation Average (NYSE:IYT)
NYSE Composite
iShares Russell 2000 (NYSE:IWM)
Financial Select Sector SPDR (NYSE:XLF)
Market Vectors Semiconductor (NYSE:SMH)
PowerShares QQQ Trust Series 1 (NASDAQ:QQQ)
SPDR Dow Jones Industrial Average (NYSE:DIA)
SPDR S&P 500 (NYSE:SPY)
Trading in financial instruments and/or cryptocurrencies involves high risks including the risk of losing some, or all, of your investment amount, and may not be suitable for all investors. Prices of cryptocurrencies are extremely volatile and may be affected by external factors such as financial, regulatory or political events. Trading on margin increases the financial risks.
Before deciding to trade in financial instrument or cryptocurrencies you should be fully informed of the risks and costs associated with trading the financial markets, carefully consider your investment objectives, level of experience, and risk appetite, and seek professional advice where needed.
Fusion Media would like to remind you that the data contained in this website is not necessarily real-time nor accurate. The data and prices on the website are not necessarily provided by any market or exchange, but may be provided by market makers, and so prices may not be accurate and may differ from the actual price at any given market, meaning prices are indicative and not appropriate for trading purposes. Fusion Media and any provider of the data contained in this website will not accept liability for any loss or damage as a result of your trading, or your reliance on the information contained within this website.
It is prohibited to use, store, reproduce, display, modify, transmit or distribute the data contained in this website without the explicit prior written permission of Fusion Media and/or the data provider. All intellectual property rights are reserved by the providers and/or the exchange providing the data contained in this website.
Fusion Media may be compensated by the advertisers that appear on the website, based on your interaction with the advertisements or advertisers.