Long-Term Returns For The NASDAQ 100
Brian Gilmartin | Jan 06, 2021 12:38AM ET
In the study we did of S&P 500 returns for the last decade, the 20 years and since 1990, the NASDAQ was omitted, so just out curiosity, and thanks to a comment Michael Santoli of CNBC made late last week when he noted that the years where the NASDAQ 100 or the QQQs were up 40% two years in a row, has historically spelled trouble for the market, I thought it was worth a look to draw some return comparison between the SP 500 and the NASDAQ 100 or QQQs:
- 1-yr return: SP 500 +18.34%. QQQ’s +48.46%
- 2-yr return: SP 500 +55.68%, QQQ’s +106.5% (average annual returns are +24.73% and +43.64%)
- 3-yr return: SP 500 +48.85%. QQQ’s +106.3% (average annual returns are +14.14% and 20.21%
- 5-yr return: SP 500 +103%. QQQ’s +193% (average annual returns are +15.20% and +23.97%)
- Since 2010: SP 500 +322%. QQQ’s +664.7% (average annual returns are +13.98% and +20.30%)
- Since 2000: SP 500 +284%. QQQ’s +294% (average annual returns are +6.61% and +6.64%)
The left-hand returns are cumulative, while the parentheses returns are “average annual”.
What’s fascinating to me is that looking back 20 years to 1/1/2000, both the S&P 500 and the NASDAQ 100 returns are still average, to below average.
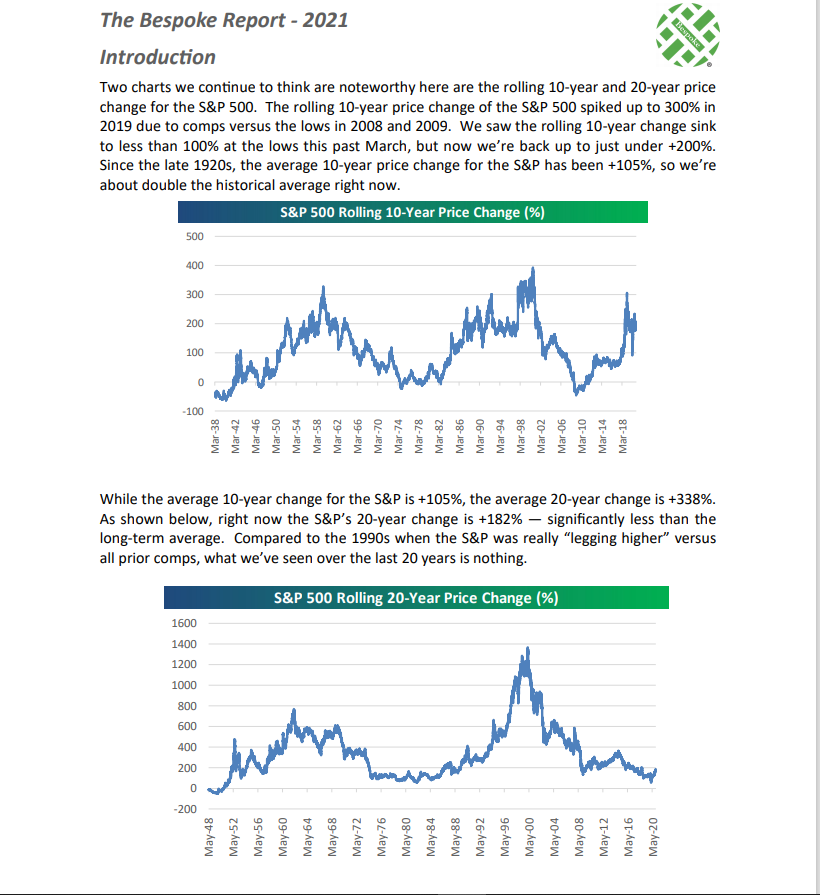
In this chart Bespoke confirms our conclusion from the November 27th, 2020 report linked above.
For you stat junkies, in 2018, the S&P 500 fell 4.5% after the fed funds rate and China trade war caught up to the S&P 500 in the 4th quarter of 2018, so readers should note the difference in the 2-year and 3-year returns, and not the cumulative returns, but the average annual returns.
It doesn’t take much—just a flat year even—to pull down average, annual returns for the benchmarks.
Summary / conclusion
My conclusion is pretty much the same looking at the NASDAQ 100 versus the S&P 500: looking at the last 21 years, the long-term returns are slightly below-average, while the most recent 1—5 years returns are—well—quite extended. This was the same conclusion from the blog post linked in the first sentence on this post.
Sentiment is very bullish coming into 2021 and that is worrisome.
Trading in financial instruments and/or cryptocurrencies involves high risks including the risk of losing some, or all, of your investment amount, and may not be suitable for all investors. Prices of cryptocurrencies are extremely volatile and may be affected by external factors such as financial, regulatory or political events. Trading on margin increases the financial risks.
Before deciding to trade in financial instrument or cryptocurrencies you should be fully informed of the risks and costs associated with trading the financial markets, carefully consider your investment objectives, level of experience, and risk appetite, and seek professional advice where needed.
Fusion Media would like to remind you that the data contained in this website is not necessarily real-time nor accurate. The data and prices on the website are not necessarily provided by any market or exchange, but may be provided by market makers, and so prices may not be accurate and may differ from the actual price at any given market, meaning prices are indicative and not appropriate for trading purposes. Fusion Media and any provider of the data contained in this website will not accept liability for any loss or damage as a result of your trading, or your reliance on the information contained within this website.
It is prohibited to use, store, reproduce, display, modify, transmit or distribute the data contained in this website without the explicit prior written permission of Fusion Media and/or the data provider. All intellectual property rights are reserved by the providers and/or the exchange providing the data contained in this website.
Fusion Media may be compensated by the advertisers that appear on the website, based on your interaction with the advertisements or advertisers.