King Dollar Attempting To Break 3-Year Rising Support
Chris Kimble | Apr 25, 2017 09:37AM ET
Below looks at a long-term chart of the US dollar, that was shared on 12/30/16. This chart highlighted that King Dollar was facing two long term resistance lines, at the 104 zone. (See Post Here). Joe Friday was pointing out this was a rare test of resistance and could be the price zone, where a major top could take place.
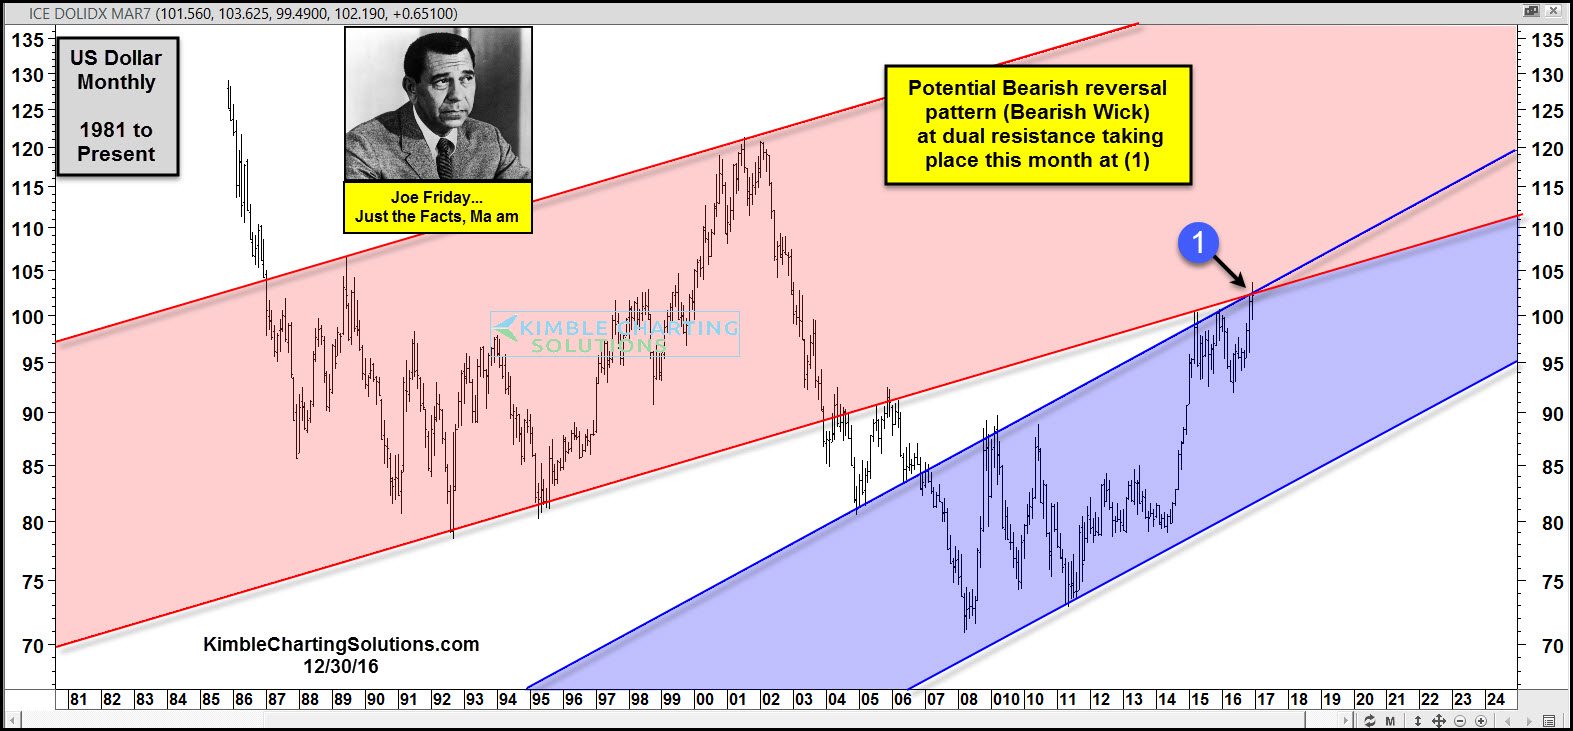
Since Joe Friday pointed out this resistance zone, King$ has declined around 5%, which could be a good reason that gold, silver and mining stocks have done very well so far this year. Below looks at an update on the price action of the US$.
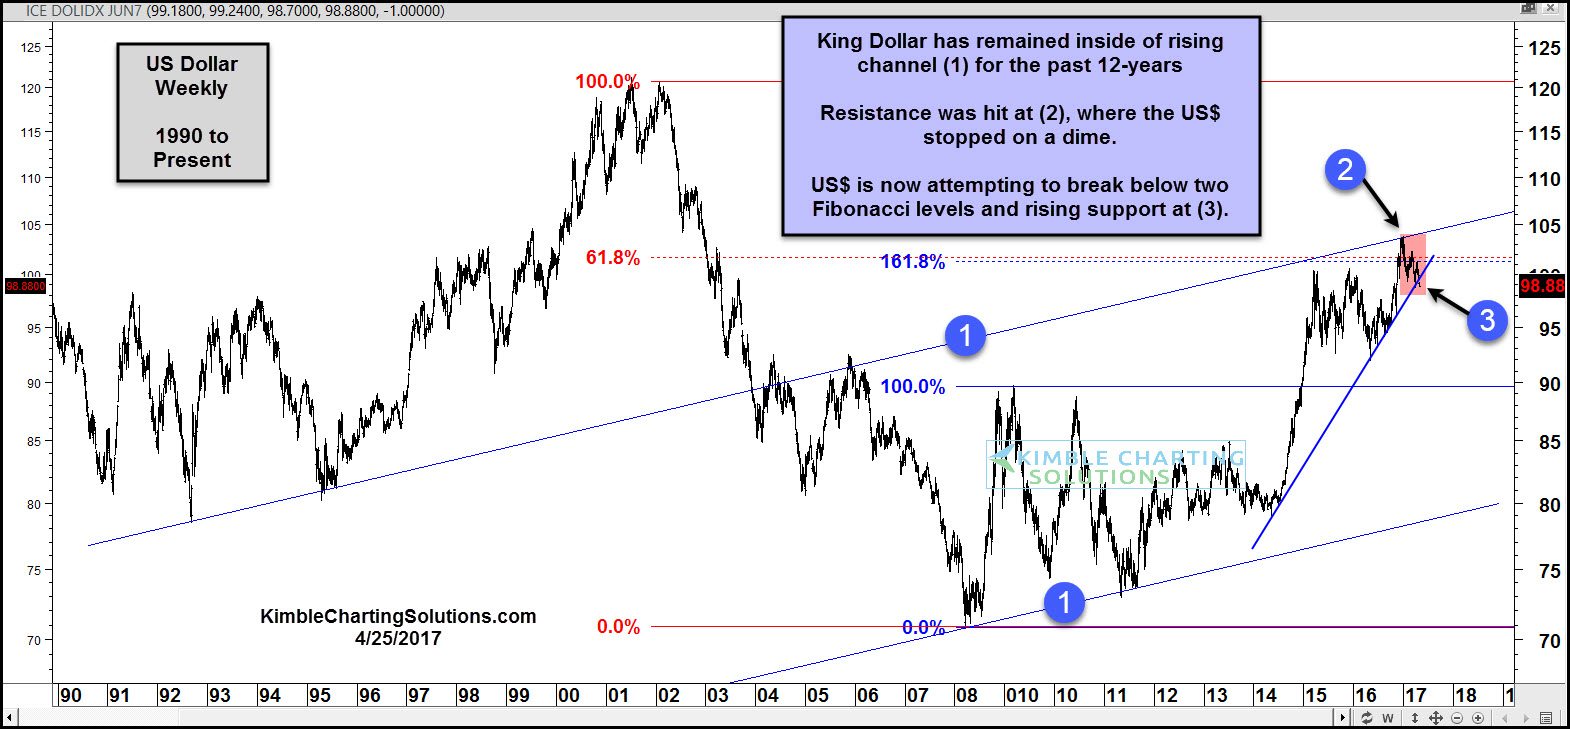
Line (1) has been support and resistance over the past 20-years. US$ hit the underside of this 20-year resistance line at (2), near the 104 zone highlighted in the top chart, where it stopped on a dime. Since hitting resistance line (1), it has declined around 5% and is back below two key Fibonacci levels.
King$ is now testing 3-year rising support at (3). A break of support at (3), could cause more selling pressure to come forward, causing the US$ to further weaken. The Power of the Pattern feels the US$ has to close on a weekly basis below the 93 level, before strong selling pressure would take place. If the 93 level would be taken out to the downside, suspect metals would attract buyers.
![]()
Trading in financial instruments and/or cryptocurrencies involves high risks including the risk of losing some, or all, of your investment amount, and may not be suitable for all investors. Prices of cryptocurrencies are extremely volatile and may be affected by external factors such as financial, regulatory or political events. Trading on margin increases the financial risks.
Before deciding to trade in financial instrument or cryptocurrencies you should be fully informed of the risks and costs associated with trading the financial markets, carefully consider your investment objectives, level of experience, and risk appetite, and seek professional advice where needed.
Fusion Media would like to remind you that the data contained in this website is not necessarily real-time nor accurate. The data and prices on the website are not necessarily provided by any market or exchange, but may be provided by market makers, and so prices may not be accurate and may differ from the actual price at any given market, meaning prices are indicative and not appropriate for trading purposes. Fusion Media and any provider of the data contained in this website will not accept liability for any loss or damage as a result of your trading, or your reliance on the information contained within this website.
It is prohibited to use, store, reproduce, display, modify, transmit or distribute the data contained in this website without the explicit prior written permission of Fusion Media and/or the data provider. All intellectual property rights are reserved by the providers and/or the exchange providing the data contained in this website.
Fusion Media may be compensated by the advertisers that appear on the website, based on your interaction with the advertisements or advertisers.