Is Twitter A Buy At About $22?
Dr. Arnout ter Schure | Jul 12, 2022 02:25PM ET
One must be living under a rock not to know Elon Musk agreed to buy Twitter (NYSE:TWTR) on April 25, and then pulled out of the deal late last week. What does all this news mean for Twitter’s share prices?
I assess TWTR’s stock chart using the Elliott Wave Principle (EWP) and several technical indicators. See Figure 1 below.
TWTR rallied for about three months from its Initial Public Offering to the mid-$70s, dropped in overlapping fashion for almost two years to the low-to-mid-$10s, rallied in overlapping fashion for about five years back to the mid-to-high-$70s only to once again fall in an overlapping manner to the current level of around $35. This pattern in EWP terms is called an irregular flat. Flat corrections consist of an A, B and C wave. Waves A and B comprise three waves (a, b, c), whereas wave C consists of five waves (1, 2, 3, 4, 5). They are labelled in blue and black, respectively. So far, this pattern has transpired since late 2013.
Figure 1. Monthly candlestick chart with detailed EWP count and with several technical indicators
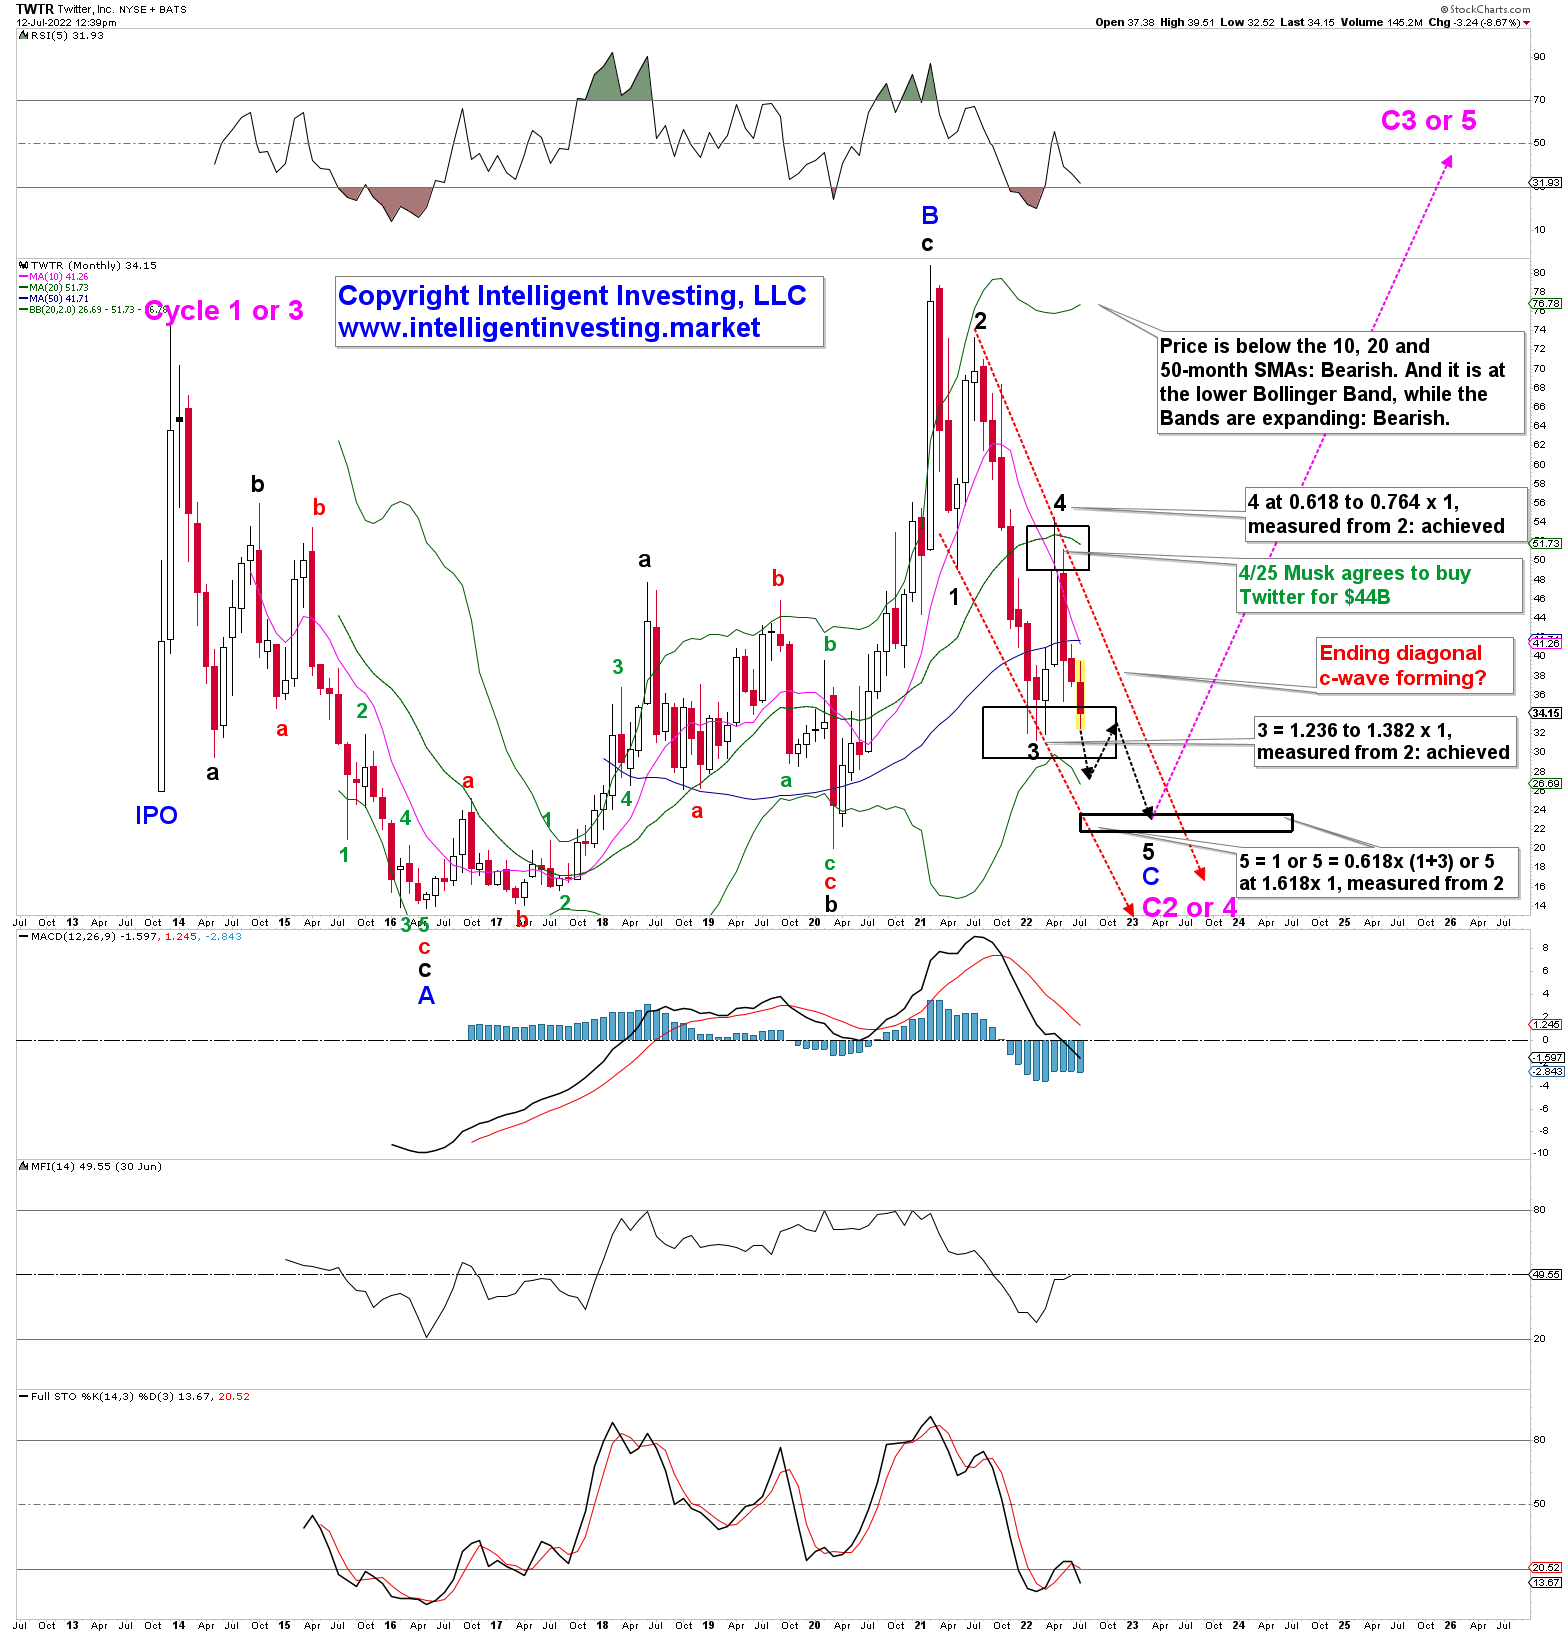
Flat corrections are often 4th waves, sometimes in 2nd waves. Thus, once the flat correction completes, a more significant 4th or 2nd wave completes, and TWTR will be ready to make new all-time-highs for an important 3rd or 5th wave (pink C3 or 5 in Figure 1). At this stage, it is unknown which of the two it is, but both will make new ATHs. Shorter-term, TWTR is most likely wrapping up (black, major) wave-5 of (blue, primary) wave-C of (pink, Cycle) wave-2/4. Note how waves 3 and 4 bottomed and peaked right where they had to if the identified ending diagonal (ED) C-wave pattern transpires. Based on that pattern and the fulfillment of the 3rd and 4th wave at their respective (ED-based) target zones, I find three individual measures for wave-5 of C of C2/4 targeting ~$22+/-1. For now, all the technical indicators are pointing lower. Price is below its 10-month, 20-m, and 50-m Simple Moving Averages (SMAs), while the Bollinger Bands (a measure of volatility/trend strength) are expanding. Thus, we should expect lower prices over the next several months.
The black dotted arrows show the anticipated path forward to the ideal target zone. But please note this chart captures price movements on the monthly time frame. Such resolution does not capture daily or weekly swings, even the recent >20% drop and today’s >4% rally. Monthly charts suit long-term trading/investing, not swing or short-term trades. TWTR will have to recapture the 50-m SMA ($41.70) at a minimum to suggest a change in trend. Conversely, a monthly close below $21 targets $14-18.
Trading in financial instruments and/or cryptocurrencies involves high risks including the risk of losing some, or all, of your investment amount, and may not be suitable for all investors. Prices of cryptocurrencies are extremely volatile and may be affected by external factors such as financial, regulatory or political events. Trading on margin increases the financial risks.
Before deciding to trade in financial instrument or cryptocurrencies you should be fully informed of the risks and costs associated with trading the financial markets, carefully consider your investment objectives, level of experience, and risk appetite, and seek professional advice where needed.
Fusion Media would like to remind you that the data contained in this website is not necessarily real-time nor accurate. The data and prices on the website are not necessarily provided by any market or exchange, but may be provided by market makers, and so prices may not be accurate and may differ from the actual price at any given market, meaning prices are indicative and not appropriate for trading purposes. Fusion Media and any provider of the data contained in this website will not accept liability for any loss or damage as a result of your trading, or your reliance on the information contained within this website.
It is prohibited to use, store, reproduce, display, modify, transmit or distribute the data contained in this website without the explicit prior written permission of Fusion Media and/or the data provider. All intellectual property rights are reserved by the providers and/or the exchange providing the data contained in this website.
Fusion Media may be compensated by the advertisers that appear on the website, based on your interaction with the advertisements or advertisers.