Is This Long-Term Volume Signal A Warning For Stocks?
Chris Ciovacco | Aug 24, 2016 12:49PM ET
Does Volume Complement Or Contradict Bullish Analysis?
An August 19 analysis outlined a long-term bullish signal for stocks that has occurred only ten other times in the last thirty-five years. Have we seen any other long-term signals in recent weeks? The answer is yes.
A Trend Change In Up/Down Volume?
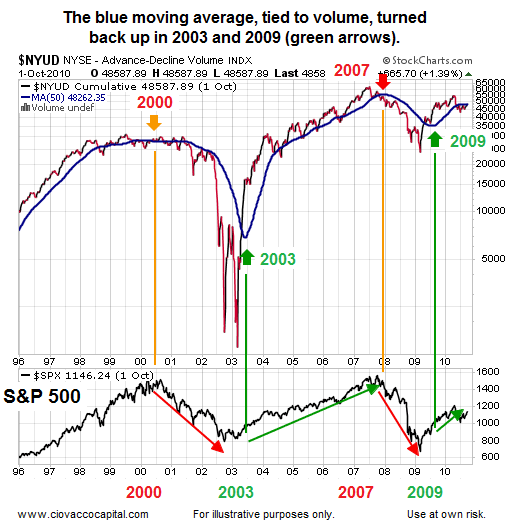
The chart below shows up/down volume (1996-2010) for the NYSE Composite Stock Index, along with its 50-week moving average (thick blue line).
Notice how all-things-being equal, the probability of bad things happening increases when the 50-week moving average is flat or negative (see orange and red arrows below). Conversely, the probability of good things happening increases when the 50-week moving average turns back up in a bullish manner (see green arrows below). The S&P 500 is shown at the bottom of the image below for reference purposes.
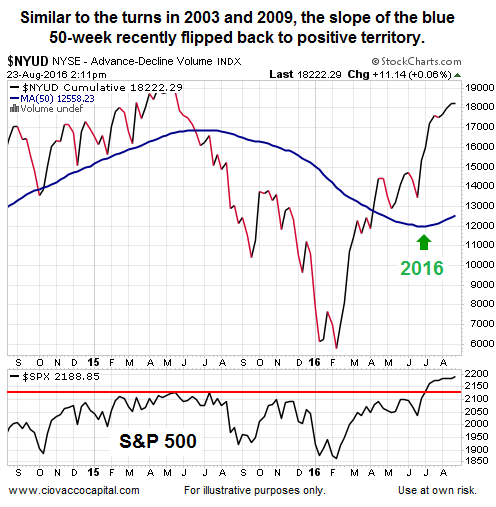
Has The Line Turned Back Up In A Bullish Manner?
The answer to the question above is 'yes'. In simplified terms, it appears as if volume patterns have shifted from favoring declining issues earlier in 2016 to favoring rising issues currently.
A Foolproof Signal?
Since there is no such thing as a foolproof indicator or signal in the financial markets, the recent bullish shift in up/down volume assists us with probabilities. As long as the slope of the 50-week remains positive, the odds of good things happening will be higher. With Yellen’s Jackson Hole speech coming Friday, the market will be processing some important new information in the coming days.
Long-Term Means Long-Term
Both the moving-average analysis covered in a recent video and the analysis above relate to longer-term outcomes, and that means weeks, months and years. Therefore, even if the bullish signals prove to be helpful, stocks could experience a fairly significant pullback before resuming the current bullish trend. Said another way, for these signals to be used effectively we must have realistic expectations about normal volatility within the context of a rising trend.
Trading in financial instruments and/or cryptocurrencies involves high risks including the risk of losing some, or all, of your investment amount, and may not be suitable for all investors. Prices of cryptocurrencies are extremely volatile and may be affected by external factors such as financial, regulatory or political events. Trading on margin increases the financial risks.
Before deciding to trade in financial instrument or cryptocurrencies you should be fully informed of the risks and costs associated with trading the financial markets, carefully consider your investment objectives, level of experience, and risk appetite, and seek professional advice where needed.
Fusion Media would like to remind you that the data contained in this website is not necessarily real-time nor accurate. The data and prices on the website are not necessarily provided by any market or exchange, but may be provided by market makers, and so prices may not be accurate and may differ from the actual price at any given market, meaning prices are indicative and not appropriate for trading purposes. Fusion Media and any provider of the data contained in this website will not accept liability for any loss or damage as a result of your trading, or your reliance on the information contained within this website.
It is prohibited to use, store, reproduce, display, modify, transmit or distribute the data contained in this website without the explicit prior written permission of Fusion Media and/or the data provider. All intellectual property rights are reserved by the providers and/or the exchange providing the data contained in this website.
Fusion Media may be compensated by the advertisers that appear on the website, based on your interaction with the advertisements or advertisers.