Is This A Bull Trap, Like October 2018 All Over Again?
Troy Bombardia | May 09, 2019 09:41PM ET
The stock market has now fallen -3.9%, which is almost to the normal -5% level of what most traders define as a “correction”. Meanwhile, the charts look like they’re making a potential “bull trap”. Combined with the fact that the S&P today is still where it was in January 2018, many traders are thinking about the potential for a flat top.
Let’s determine the stock market’s most probable medium term direction by objectively quantifying technical analysis. For reference, here’s the random probability of the U.S. stock market going up on any given day.

Bull Trap?
The S&P recently made an all-time high after a grueling 6 months, and is now instantly on the way to making a -5% correction. This has many traders perplexed and thinking that this may be a “bull trap”. Surely this means that the bulls can’t sustain bullish momentum?
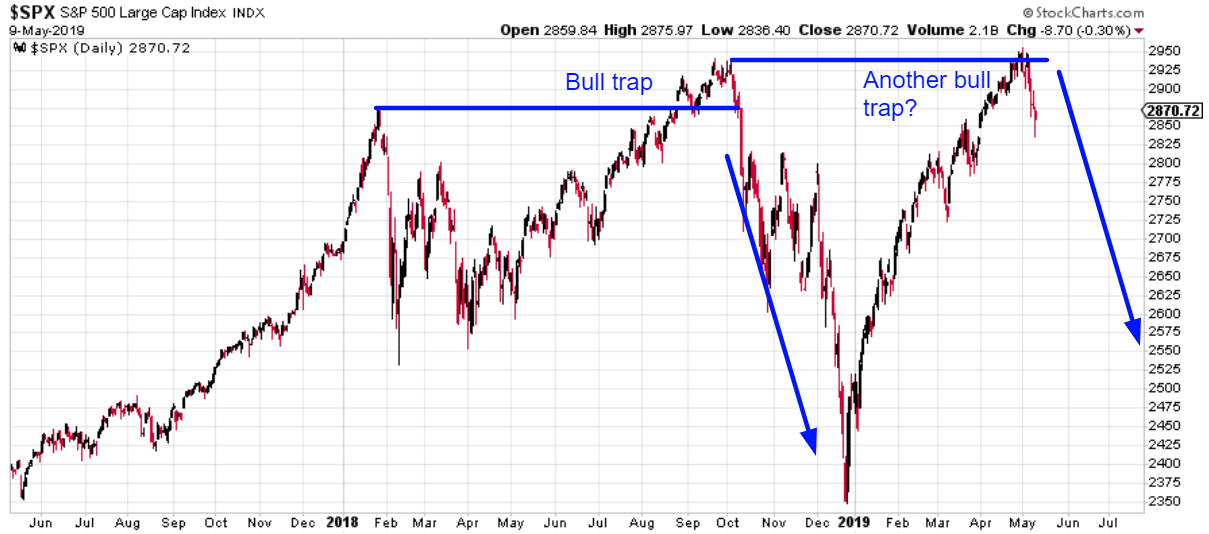
Actually, it is quite normal for the S&P to breakout to new highs and then promptly pullback. Considering that the S&P had no pullbacks during the January-April rally (very rare case), this seems to be a delayed pullback/correction.
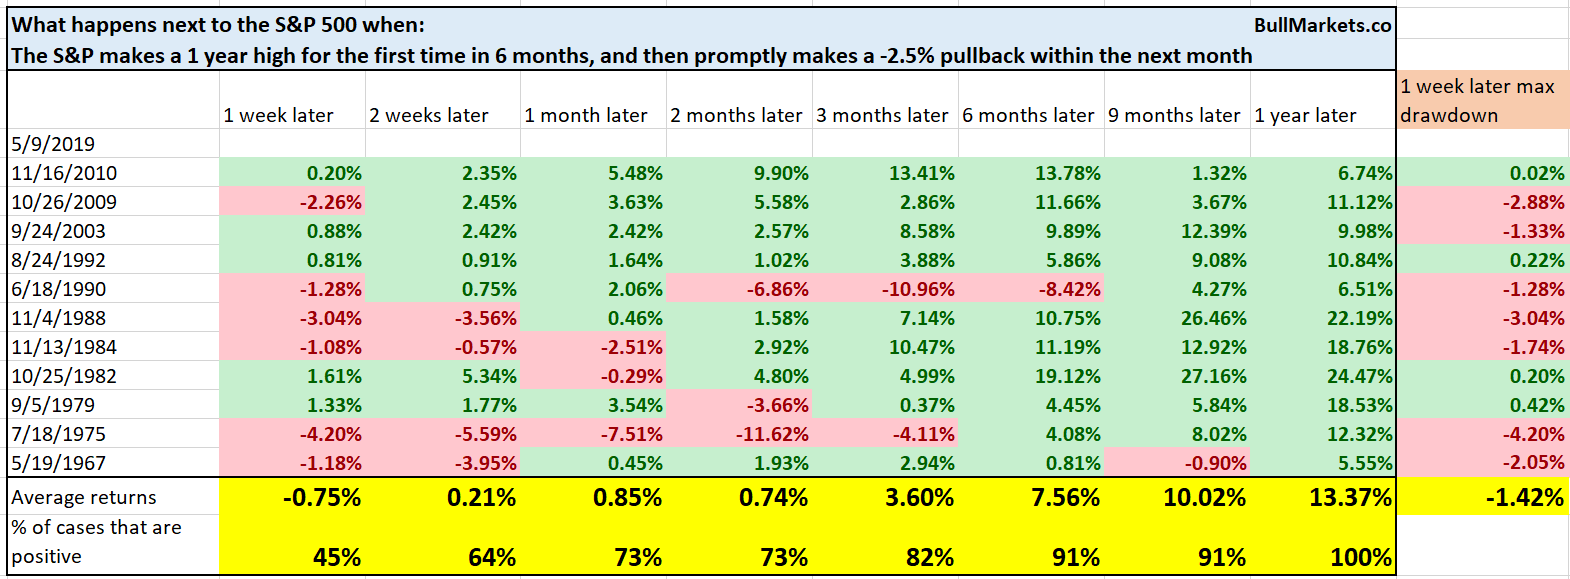
Here’s what happens next to the S&P when it makes a 1 year high for the first time in 6 months, and then promptly makes a -2.5% pullback within the next month.
*% size of pullback is defined by daily CLOSE $’s
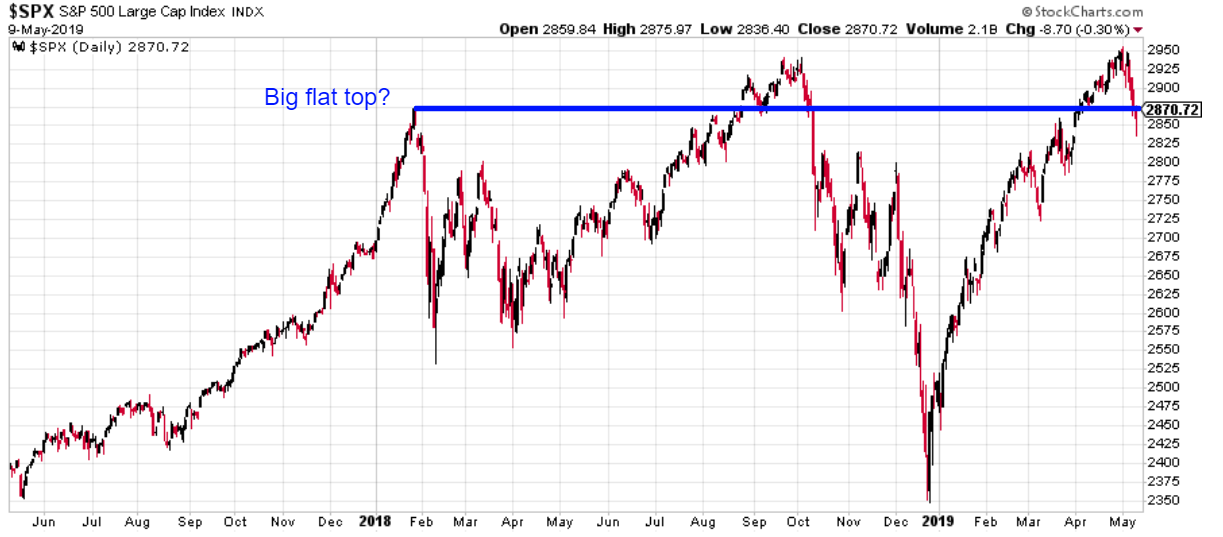
Flat top?
Considering that the S&P today is exactly where it was at the January 2018 high, many traders are thinking “is this just a big flat top?”
Here’s what happens next to the S&P when it is within 1% of where it was 321 days ago, while still within 3% of a 1 year high (e.g. flat top from January 2018 – present).
While the sample size may not be large, remember that this excludes overlaps. There aren’t a lot of 321 days from 1950 – present.
Regardless, “flat tops” usually aren’t long term bearish patterns in the stock market.
Here’s the problem with many chart patterns – they are clear in 20/20 hindsight, but in real-time aren’t that clear. This is why you see this all the time in financial media and social media.
- “The stock market looks like it’s making a head and shoulders”
- S&P 500 reaches old all-time highs: “The stock market looks like it’s making a double top”
- S&P 500 exceeds all-time highs: “The stock market is making a bull trap”
- S&P 500 exceeds all-time highs: “The NYSE Composite is still below its previous all-time high. Still in a bear market”.
Don’t move the goal post.
VIX’s spike
VIX spiked even more today on the intraday. Over the past 4 days, VIX has risen more than 80%. Such a quick spike is quite rare.
Historically, this was short term bullish for the S&P…
… and short term bearish for VIX.
What if we loosen the study’s parameters to increase the sample size?
Here’s what happens next to the S&P when VIX rises more than 70% over the past 4 days:
Less short term bullish for the S&P…
…And still short term bearish for VIX.
Dr. Copper
Copper has fallen below its 200 day moving average. Is Dr. Copper leading the S&P 500 down?
Copper falling below its 200 dma isn’t consistently bullish or bearish for the S&P…
… but is more bearish than bullish for copper over the next year.
Dow
The Dow is relatively weaker than the S&P. But like the S&P, the Dow has made a quick pullback over the past 4 days.
Here’s what happens next to the Dow when it makes a quick pullback for the first time in a long time.
Mostly random, but there is a slight bullish lean 9-12 months later.
Using momentum to classify an “uptrend” vs “downtrend”
Most traders use moving averages and support/resistance to classify “uptrends” vs. downtrends. But you can also use momentum indicators like RSI.
- If RSI is above 50, then the S&P is in an uptrend
- If RSI is below 50, then the S&P is in a downtrend
In terms of momentum, the S&P’s long uptrend is now over.
Here’s what happens next to the S&P when its 14 day RSI falls below 45 for the first time in 4 months.
Small cap low volatility
While large cap indices like the S&P and Dow have been jumping around for the past 3 months, the Russell 2000 has seen little volatility.
Is the return of low volatility bearish for small caps?
Here’s what happens next to the Russell 2000 when its 3 month standard deviation falls below 1.6% of its value.
Here’s what happens next to the S&P
Not consistently bullish or bearish over the next month, but there is a bullish lean 2-3 months later.
It’s not voodoo
With the S&P sitting right on top of its 50 day moving average, I have seen a some traders claim “if the S&P closes below its 50 dma, it’s all over. The last time this happened was October 2018”.
These sort of statements unfortunately lead a lot of new traders into treating technical analysis as if it was voodoo
- “If this support is broken, the market will head lower”. That’s like saying “if the market falls below $12, then next stop is $11. If it falls below $11, the next stop is $10. If it falls below $10, the next stop is $9….” (Stating the obvious)
- “The market needs to hold above its 200 day moving average, otherwise it’ll keep falling”. This treats certain moving averages like the 200 day moving (or 50 dma) as if they’re “magical lines on a chart”.
There’s nothing “magical” or special about popular support and resistance lines like the 50 dma or 200 dma. To sell you their message, trading experts will tell you “when the S&P held above its 200 dma, it rallied. And when it broke below its 200 dma, it fell even more.”
But the same can be said about the 197 dma…
Or the 204 dma…
Or the 211 dma
Or the 189 dma
Technical analysis works. We use it in our trading models. But it isn’t voodoo. There’s no such thing as “if the S&P doesn’t hold above its 50 dma, it’ll head much lower”. You can say the same for:
- “If the S&P doesn’t hold above its 56 dma, it’ll head much lower.”
- “If the S&P doesn’t hold above its 55 dma, it’ll head much lower.”
- “If the S&P doesn’t hold above its 54 dma, it’ll head much lower.”
- “If the S&P doesn’t hold above its 53 dma, it’ll head much lower.”
- “If the S&P doesn’t hold above its 52 dma, it’ll head much lower.”
- “If the S&P doesn’t hold above its 51dma, it’ll head much lower.”
- “If the S&P doesn’t hold above its 49 dma, it’ll head much lower.”
- “If the S&P doesn’t hold above its 48 dma, it’ll head much lower.”
Here’s the data to prove that there is nothing different between popular support/resistance lines and less popular support/resistance lines.
Conclusion
Here is our discretionary market outlook:
- The U.S. stock market’s long term risk:reward is no longer bullish. In a most optimistic scenario, the bull market probably has 1 year left. Long term risk:reward is more important than trying to predict exact tops and bottoms.
- The medium term direction (e.g. next 6-9 months) has a bullish lean.
- We don’t predict the short term because the short term is always extremely random, no matter how much conviction you think you have. Focus on the medium-long term.
Goldman Sachs’ Bull/Bear Indicator demonstrates that risk:reward does favor long term bears.
Trading in financial instruments and/or cryptocurrencies involves high risks including the risk of losing some, or all, of your investment amount, and may not be suitable for all investors. Prices of cryptocurrencies are extremely volatile and may be affected by external factors such as financial, regulatory or political events. Trading on margin increases the financial risks.
Before deciding to trade in financial instrument or cryptocurrencies you should be fully informed of the risks and costs associated with trading the financial markets, carefully consider your investment objectives, level of experience, and risk appetite, and seek professional advice where needed.
Fusion Media would like to remind you that the data contained in this website is not necessarily real-time nor accurate. The data and prices on the website are not necessarily provided by any market or exchange, but may be provided by market makers, and so prices may not be accurate and may differ from the actual price at any given market, meaning prices are indicative and not appropriate for trading purposes. Fusion Media and any provider of the data contained in this website will not accept liability for any loss or damage as a result of your trading, or your reliance on the information contained within this website.
It is prohibited to use, store, reproduce, display, modify, transmit or distribute the data contained in this website without the explicit prior written permission of Fusion Media and/or the data provider. All intellectual property rights are reserved by the providers and/or the exchange providing the data contained in this website.
Fusion Media may be compensated by the advertisers that appear on the website, based on your interaction with the advertisements or advertisers.