3 Down, 1 To Go: Q4 2017 Looms For U.S. Equities
Candy Matheson | Oct 01, 2017 12:16AM ET
The following charts and graphs present a simplified birds-eye view of how the S&P 500 Index, and its volatility, performed in Q3 of 2017, as well as year-to-date.
But, first, a look at the Major Indices and 9 Major Sectors and how they have fared year-to-date and during Q3...
MAJOR INDICES
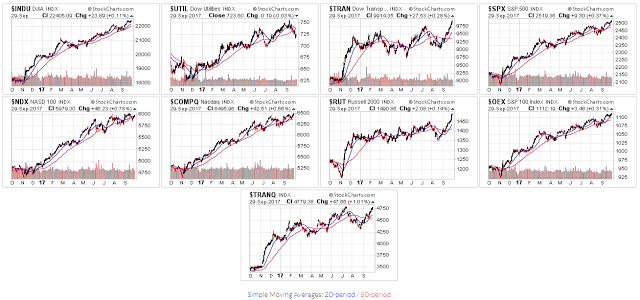
Eight of the nine Major Indices, namely, the Dow 30, Dow Transports, S&P 500, NASDAQ 100, NASDAQ Composite, Russell 2000, S&P 100, and NASDAQ Transportation Indices closed out Q3 at or near all-time highs, as shown on the following 1-Year Daily charts.
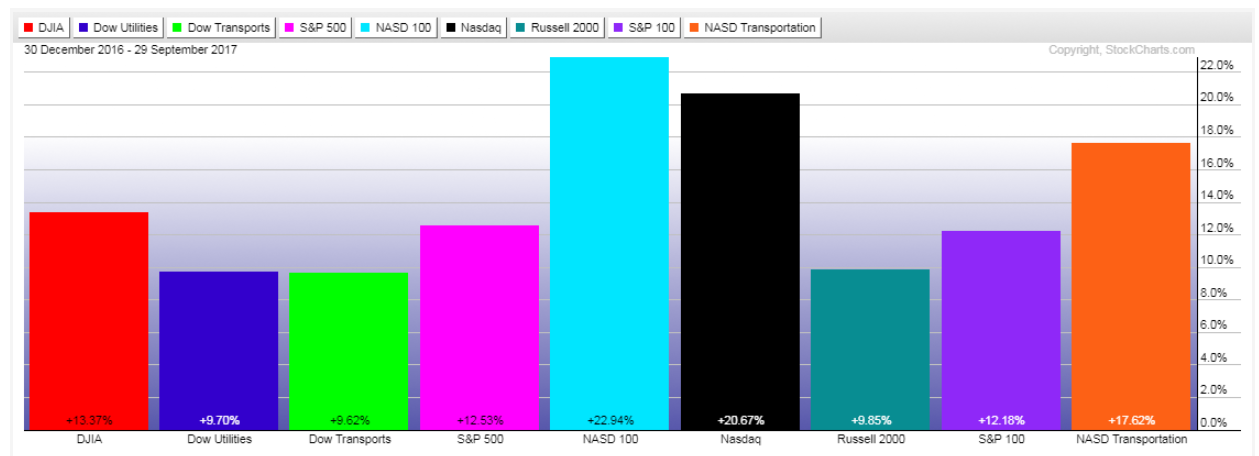
The following Year-to-date graph shows the percentages gained for the Major Indices.
The SPX has gained 12.53%, so far, this year. This exceeds my forecast of around an 11% gain for the entire year, as outlined in my post from the beginning of December 2016. The Dow 30 regained and held its footing above 22,000, and the SPX, OEX, and NDX reached their "Big Round Numbers" of 2500, 1100, and 6000, respectively, as I cited as a possibility in early August.
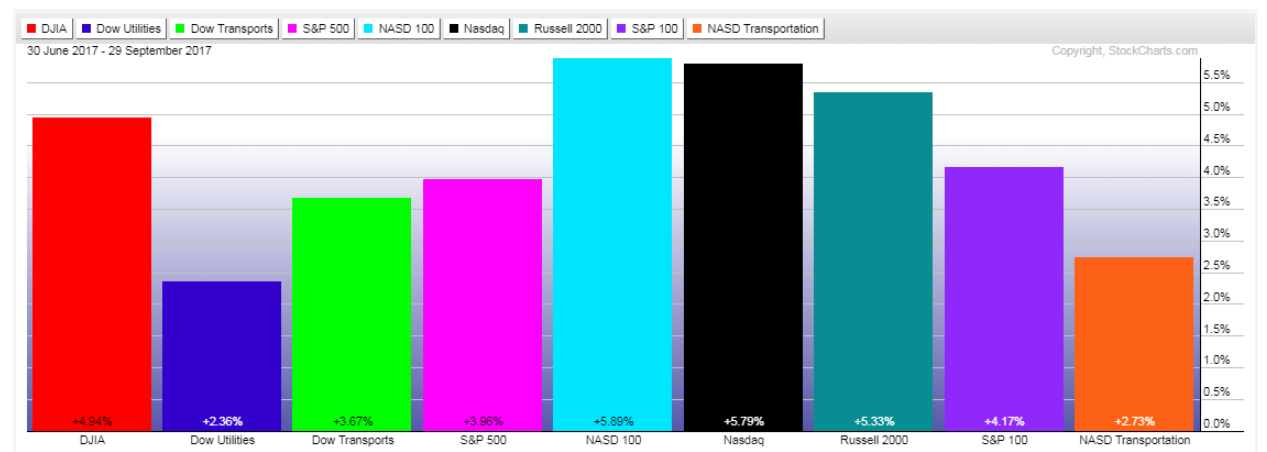
The next graph shows the percentages gained during Q3 for these Major Indices.
Market players were willing to add more risk in the form of Small-cap stocks.
9 MAJOR SECTORS
Four of the nine Major Sectors closed out Q3 at or near their highs for the year, namely, Technology, Industrials, Materials, and NYSE:Financials, as shown on the following 1-Year Daily charts.
Technology and Health Care have gained the most, so far, this year, followed by Industrials, Materials, Financials, Utilities, Cyclicals, and Consumer Staples, while Energy is -6.69%, as shown on the following Year-to-date graph.
The leader for Q3 of 2017 is Technology, followed by Energy, Materials, Financials, Industrials, Health Care, Utilities, Cyclicals, while Consumer Staples is -1.13%.
S&P 500 INDEX
Each candle on the following four charts of the SPX represents a period of one year, one quarter, one month, and one week, respectively.
Its price, at 2500, is now entangled in a web of triple major resistance in the form of a 27-year Fibonacci fanline, an 8-year Fibonacci fanline and an 8-year external Fibonacci retracement level.
The momentum indicator is presenting somewhat mixed signals on these timeframes...with the weekly, monthly and quarterly hinting of a possible buying slowdown, stagnation, or reversal looming in Q4:
.
SPX:VIX RATIO
Each candle on the following four charts of the SPX:VIX ratio represents a period of one year, one quarter, one month, and one week, respectively. Price has closed near its all-time high and will be facing major channel and external Fib retracement resistance around the 280 level.
The momentum indicator is also presenting mixed signals on these timeframes...with the weekly and monthly hinting of possible higher volatility occurring in Q4. I recently wrote about higher volatility looming for Q4 here. Price will need to remain above 250 in the short term, and above the 200 New Bull Market level in the medium term, in order to confirm a sustainable upward bias for the SPX.
With both the SPX and SPX:VIX ratio at/near their all-time highs, and at or near long-term major resistance, technically, we could very well see some major profit-taking occur in equities, in general, in Q4, on increasing volatility, with a rotation into Commodities, the U.S. dollar, Cyclicals, Consumer Staples, Utilities, and maybe Financials.
Watch for the SPX to either remain above 2500, or drop below...and for price on the SPX:VIX ratio to either remain above the 250 level, or drop below...to signal either continued low volatility, or an increase for Q4 of 2017.
Trading in financial instruments and/or cryptocurrencies involves high risks including the risk of losing some, or all, of your investment amount, and may not be suitable for all investors. Prices of cryptocurrencies are extremely volatile and may be affected by external factors such as financial, regulatory or political events. Trading on margin increases the financial risks.
Before deciding to trade in financial instrument or cryptocurrencies you should be fully informed of the risks and costs associated with trading the financial markets, carefully consider your investment objectives, level of experience, and risk appetite, and seek professional advice where needed.
Fusion Media would like to remind you that the data contained in this website is not necessarily real-time nor accurate. The data and prices on the website are not necessarily provided by any market or exchange, but may be provided by market makers, and so prices may not be accurate and may differ from the actual price at any given market, meaning prices are indicative and not appropriate for trading purposes. Fusion Media and any provider of the data contained in this website will not accept liability for any loss or damage as a result of your trading, or your reliance on the information contained within this website.
It is prohibited to use, store, reproduce, display, modify, transmit or distribute the data contained in this website without the explicit prior written permission of Fusion Media and/or the data provider. All intellectual property rights are reserved by the providers and/or the exchange providing the data contained in this website.
Fusion Media may be compensated by the advertisers that appear on the website, based on your interaction with the advertisements or advertisers.